Category: Stock Investment Education

  • Russia’s war on Ukraine sets the stage for worst food crisis in decades

    Russia’s war on Ukraine sets the stage for worst food crisis in decades

    Russia’s invasion of Ukraine has roiled commodity markets and set the stage for the worst food crisis in decades, one that risks not just sharply higher prices at grocery stores but the spread of social unrest around the globe.

    Russia and Ukraine make up a quarter of global wheat exports, and are near the top of the production list when it comes to other agricultural goods such as barley, corn, potatoes, sunflowers and sugar beets.

    Food shipments from the two countries have already ground to a halt, sending shock waves through commodity markets. Wheat futures in Chicago were up by 70 per cent this year at the start of last week before tumbling. They remain up 40 per cent from mid-February.

    Inside a frantic race to get Ukrainian corn and wheat to world markets

    Agriculture disruptions caused by war in Ukraine could ‘escalate food insecurity globally,’ UN agency warns

    How Russia’s invasion of Ukraine is affecting investments in the agriculture sector

    The collapse in grain supplies, sparked by both the war and Western retaliatory sanctions, have led to fears of shortages in countries that depend heavily on wheat from the region.

    Egypt, which draws more than two-thirds of its wheat imports from Russia and Ukraine, imposed its own ban on the export of food staples such as flour and lentils last week.

    Other countries, such as Lebanon and Indonesia, have banned exports of some vegetables, grains and palm oil in an effort to safeguard domestic food supplies. Those protectionist measures are in turn leading to higher prices.

    “Having interconnected global markets was always a huge benefit, because we gained from trade and lower prices, but we’re seeing how shocks can ripple across many markets and countries when you get a huge disruption like this,” said Jill Hobbs, a professor of agricultural and resource economics at the University of Saskatchewan.

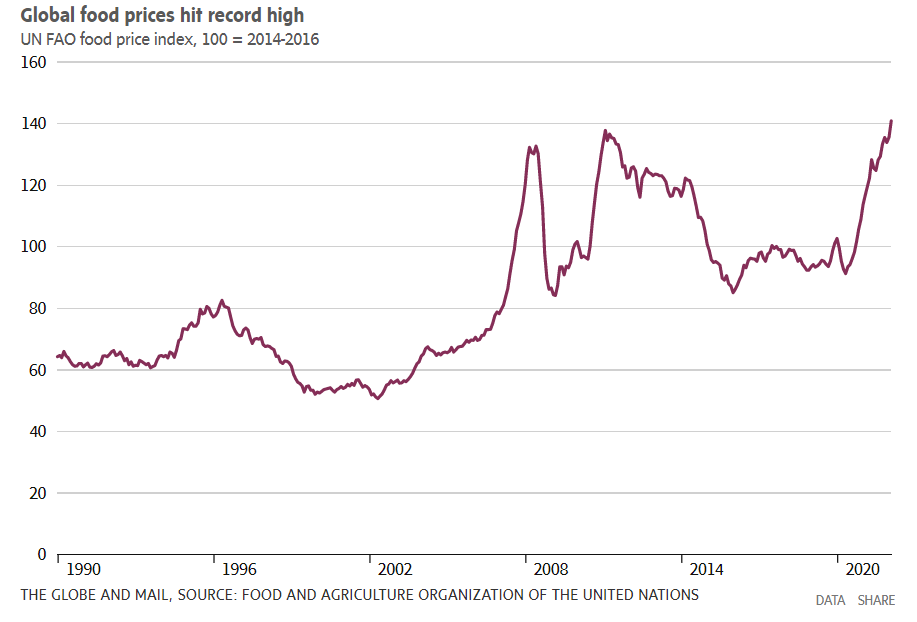
    Global food prices reached record levels, even before the full shock to commodity prices from the Russian invasion had been felt, according to the benchmark index of the United Nation’s Food and Agricultural Organization (FAO).Global food prices hit record highUN

    On Friday, the agency warned that other grain-producing countries could only partly make up for the shortfall in exports from Russia and Ukraine, meaning international feed and food prices could jump by another eight to 22 per cent in the coming months.

    “The likely disruptions to agricultural activities of these two major exporters of staple commodities could seriously escalate food insecurity globally,” FAO director-general Qu Dongyu said in a statement.

    With Russia’s bombardment of Ukraine widening by the day, planting season in a country often described as Europe’s breadbasket is certain to be disrupted.

    One Ukrainian farmer near Odesa, Oleksandr Chumak, said he expects wheat output from his farm to at least be cut in half. “Every day, I see rockets fly over my house,” he said.

    But the war in Ukraine is also wreaking havoc on global food supplies in less direct, yet critical ways.

    Energy prices have surged to historic highs amid concerns of tight oil supplies and disruptions to the supply of oil and gas from Russia. The U.S. has banned energy imports from Russia, while Moscow is threatening to shut off gas to Europe. Soaring energy prices are making it vastly more expensive to produce, process and transport food.

    The war has also threatened the global supply of fertilizer, which farmers rely on to boost crop yields. Russia is the world’s top exporter of nitrogen fertilizers and the second largest supplier of both potassic and phosphorous fertilizers.

    Moscow has proposed a ban on raw-material exports, but has yet to say which commodities it will cover, with some analysts saying that fertilizer nutrients could be among them. Fertilizer prices have begun to climb higher on concerns of a supply disruption.

    The combination of factors pushing up food prices are sparking fears of widespread suffering, particularly in developing countries. French President Emmanuel Macron last week warned that “several African countries will be affected by famine within 12 to 18 months precisely because of this war.”

    Some in the fertilizer industry share that concern.

    “For me, it’s not whether we are moving into a global food crisis, it’s how large the crisis will be,” said Svein Tore Holsether, president of Norway’s Yara International, the world’s largest maker of nitrogen-based fertilizers.

    Mr. Holsether said he worries that food shortages will leave tens of millions of people around the world without enough to eat.

    It’s a volatile situation, given the history of how food shortages and hunger have contributed to unrest. Food insecurity is widely seen as one of the contributing factors behind the Arab Spring revolts in the early part of the past decade.

    In a report last week, BCA Research warned that the disruption to food and fertilizer markets will have far-reaching geopolitical consequences.

    “Lenin famously called wheat the ‘currency of currencies,’ implying that those who control the distribution of wheat can control the political system,” BCA chief strategist Peter Berezin wrote. “With countries such as Egypt desperately dependent on Russian and Ukrainian wheat exports, a shortage of this critical foodstuff could lead to political turmoil in a number of develop­ing nations.”

    In Canada, the cost of food is already rising at the fastest pace in 13 years. That’s a result of the effects of the COVID-19 pandemic such as labour shortages, rising energy prices and disruptions to supply chains.

    Canadians will get the latest update on food costs on Wednesday when Statistics Canada releases consumer prices for the month of February, which are expected to confirm the pain grocery shoppers are already feeling.

    In the United States, where inflation numbers for February were released last week, food prices jumped 7.8 per cent over the year before.

    Farmers in Canada are eyeing the surge in grain prices as they decide what to plant in the spring, said Prof. Hobbs. However, they will also have to contend with skyrocketing energy and fertilizer costs, which could erase any windfall gains from higher prices.

    At the same time, farmers in Western Canada had already seen their output of wheat last year slashed by drought, with wheat production down 38.5 per cent from the year before, according to Statistics Canada.

    The latest drought assessment from the federal government for February found that 65 per cent of Canada’s agricultural areas were experiencing some level of drought conditions, suggesting another bleak year.

    “It sounds great for farmers when people say prices are high, but it’s a more complex picture than that,” Prof. Hobbs said.

  • Calendar: March 14, 2022

    Economic Calendar Mar 14 – Mar 18, 2022

    Monday March 14

    (8:30 a.m. ET) Canadian construction investment for January.

    (8:30 a.m. ET) Canadian new motor vehicle sales for January. Estimate is a rise of 0.5 per cent year-over-year.

    Earnings include: Hardwoods Distribution Inc.; Pollard Banknote Ltd.

    Tuesday March 15

    China industrial production, retail sales and fixed asset investment

    Euro zone industrial production

    (8:15 a.m. ET) Canadian housing starts for February. The Street is forecasting an annualized rate increase of 2.4 per cent.

    (8:30 a.m. ET) Canada’s manufacturing sales and new orders for January. Estimates are month-over-month increases of 1.2 per cent and 1.5 per cent, respectively.

    (8:30 a.m. ET) U.S. PPI final demand for February. Consensus is a rise of 0.9 per cent from January and up 9.9 per cent year-over-year.

    (8:30 a.m. ET) U.S. Empire State Manufacturing Survey for March.

    (9 a.m. ET) Canadian existing home sales for February. Estimate is a year-over-year decline of 7 per cent with average prices rising 20.5 per cent.

    (9 a.m. ET) Canada’s MLS Home Price Index for February. Estimate is a rise of 28.0 per cent from the same period a year ago.

    Earnings include: Alimentation Couche-Tard Inc.; Intertape Polymer Group Inc.

    Wednesday March 16

    Japan trade balance and industrial production

    (8:30 a.m. ET) Canada’s CPI for February. Consensus is a rise of 0.9 per cent from January and up 5.5 per cent year-over-year.

    (8:30 a.m. ET) Canadian wholesale trade for January. Estimate is an increase of 3.5 per cent from December.

    (8:30 a.m. ET) U.S. retail sales for February. The Street is projecting a rise of 0.4 per cent from January.

    (8:30 a.m. ET) U.S. import prices for February. Consensus is a month-over-month increase of 1.5 per cent and up 11.2 per cent year-over-year.

    (10 a.m. ET) U.S. NAHB Housing Market Index for March.

    (10 a.m. ET) U.S. business inventories for January.

    (2 p.m. ET) U.S. Fed announcement with chair Jerome Powell’s press briefing to follow.

    Earnings include: Largo Resources Ltd.; Osisko Mining Corp.

    Thursday March 17

    Japan core machine orders

    Euro zone CPI

    (8:30 a.m. ET) U.S. weekly initial jobless claims. Estimate is 218,000, down 9,000 from the previous week.

    (8:30 a.m. ET) U.S. housing starts for February. Consensus is annualized rate rise of 3.8 per cent.

    (8:30 a.m. ET) U.S. building permits for February.

    (9:15 a.m. ET) U.S. industrial production and capacity utilization for February.

    Earnings include: Badger Infrastructure Solutions Ltd.; Canoe EIT Income Fund; Endeavour Mining Corp.; MDA Ltd.; Nexus REIT; North West Company Inc.; Power Corp. of Canada

    Friday March 18

    Japan CPI

    Euro zone trade deficit and labour costs

    (8:30 a.m. ET) Canadian retail sales for January. The Street is projecting a rise of 2.4 per cent from December.

    (8:30 a.m. ET) Canada’s New Housing Price Index for February. Estimate is a rise of 2.5 per cent from January and 12.5 per cent year-over-year.

    (10 a.m. ET) U.S. existing home sales for February. Consensus is an annualized rate drop of 5.0 per cent.

    (10 a.m. ET) U.S. leading indicator for February. Estimate is a rise of 0.3 per cent from January.

  • Economic Calendar Ending March 11, 2022

    Calendar: What investors need to know for the week ahead

    Monday March 7

    China foreign reserves and trade surplus

    Germany factory orders and retail sales

    (3 p.m. ET) U.S. consumer credit for January.

    Earnings include: Cargojet Inc.; Vermilion Energy Inc.

    Tuesday March 8

    China aggregate yuan financing, new yuan loans and money supply

    Japan current account balance and bank lending

    Euro zone GDP

    Germany industrial production

    (8:30 a.m. ET) Canada’s merchandise trade balance for January.

    (8:30 a.m. ET) U.S. goods and services trade deficit for January.

    (10 a.m. ET) U.S. wholesale inventories for January.

    Earnings include: Ag Growth International Inc.; Evertz Technologies Ltd.; Ero Copper Corp.; InterRent REIT; Ivanhoe Mines Ltd.; Nuvei Corp.; Spartan Delta Corp.; Transcontinental Inc.

    Wednesday March 9

    China CPI and PPI

    Japan GDP and machine tool orders

    (10 a.m. ET) U.S. Job Openings & Labor Turnover Survey for January.

    Earnings include: Franco-Nevada Corp.; Granite REIT; LifeWorks Inc.; Linamar Corp.; NuVista Energy Ltd.; Pet Valu Holdings Ltd.; Peyto Exploration & Development Corp.; Pipestone Energy Corp.; Stella-Jones Inc.; WPT Industrial REIT; WSP Global Inc.

    Thursday March 10

    China foreign direct investment

    ECB Monetary Policy meeting

    (8:30 a.m. ET) U.S. initial jobless claims for week of March 5. Estimate is 220,000, up 5,000 from last week.

    (8:30 a.m. ET) U.S. CPI for February. The consensus forecast on the Street is a rise of 0.5 per cent from January and 7.9 per cent year-over-year.

    (2 p.m. ET) U.S. budget balance for February.

    Earnings include: Docebo Inc.; Empire Company Ltd.; Endeavour Silver Corp.; First Majestic Silver Corp.; Northwest Healthcare Properties REIT; Headwater Exploration Inc.; Intertape Polymer Group Inc.; Kelt Exploration Ltd.; NFI Group Inc.; Paramount Resources Ltd.; Premium Brands Holdings Corp.; Pretium Resources Inc.; Wesdome Gold Mines Ltd.; Wheaton Precious Metals Corp.

    Friday March 11

    Japan household spending

    Germany CPI

    (8:30 a.m. ET) Canadian employment for February. The Street is forecasting an increase of 0.7 per cent, or 125,000 jobs, from January with the unemployment rate sliding 0.2 per cent to 6.3 per cent.

    (8:30 a.m. ET) Canada’s capacity utilization for Q4.

    (8:30 a.m. ET) Canada’s national balance sheet and financial flow accounts for Q4.

    (10 a.m. ET) U.S. University of Michigan Consumer Sentiment for March.

    Earnings include: Energy Fuels Inc.; Trillium Therapeutics Inc.

  • Bank of Nova Scotia and Bank of Montreal report surging profits as lending drives stronger banking revenue

    https://www.theglobeandmail.com/business/article-bank-of-montreal-tops-quarterly-profit-expectations-on-strong-retail/

    Bank of Nova Scotia BNS-T -1.05%decrease and Bank of Montreal BMO- T -0.04%decrease reported rising first-quarter profits as the pace of lending to businesses and consumers picks up in Canada and abroad, driving stronger retail banking revenue.

  • European Central Bank member says its bond buying could end in the third quarter

    [et_pb_section][et_pb_row][et_pb_column type=”4_4″][et_pb_text]

    PUBLISHED WED, FEB 16 2022

    https://www.cnbc.com/2022/02/16/european-central-bank-bond-buying-could-end-in-q3-frances-villeroy.html

    Click on link above for details

    ECB – European Central Bank
    [/et_pb_text][/et_pb_column][/et_pb_row][/et_pb_section]
  • February Begins with a Bang!

    [et_pb_section fb_built=”1″ admin_label=”section” _builder_version=”3.22″ global_colors_info=”{}” theme_builder_area=”post_content”][et_pb_row admin_label=”row” _builder_version=”3.25″ background_size=”initial” background_position=”top_left” background_repeat=”repeat” global_colors_info=”{}” theme_builder_area=”post_content” min_height=”1486.7px” custom_padding=”20px|||||” custom_margin=”-100px|auto||auto||”][et_pb_column type=”4_4″ _builder_version=”3.25″ custom_padding=”|||” global_colors_info=”{}” custom_padding__hover=”|||” theme_builder_area=”post_content”][et_pb_text admin_label=”Text” _builder_version=”3.27.4″ background_size=”initial” background_position=”top_left” background_repeat=”repeat” global_colors_info=”{}” theme_builder_area=”post_content”]

    As you can see from the Email that was sent out on Feb 4 – Suggested Stocks To Track. 5 names were given with a suggested Buy Price; Sell Price & a Stop Loss Price.

    The following is what we achieved based on our knowledge of technical analysis

    The Evidence Demands A Verdict

    https://gem.godaddy.com/p/6994831

    [/et_pb_text][/et_pb_column][/et_pb_row][/et_pb_section]