Executive Summary
- Canada’s June CPI on Monday is the principal scheduled TSX event. It will influence Bank of Canada rate expectations, bond yields, the Canadian dollar and rate-sensitive sectors.
- Canada’s May retail-sales report on Thursday will provide the clearest reading on household spending and consumer-sector demand.
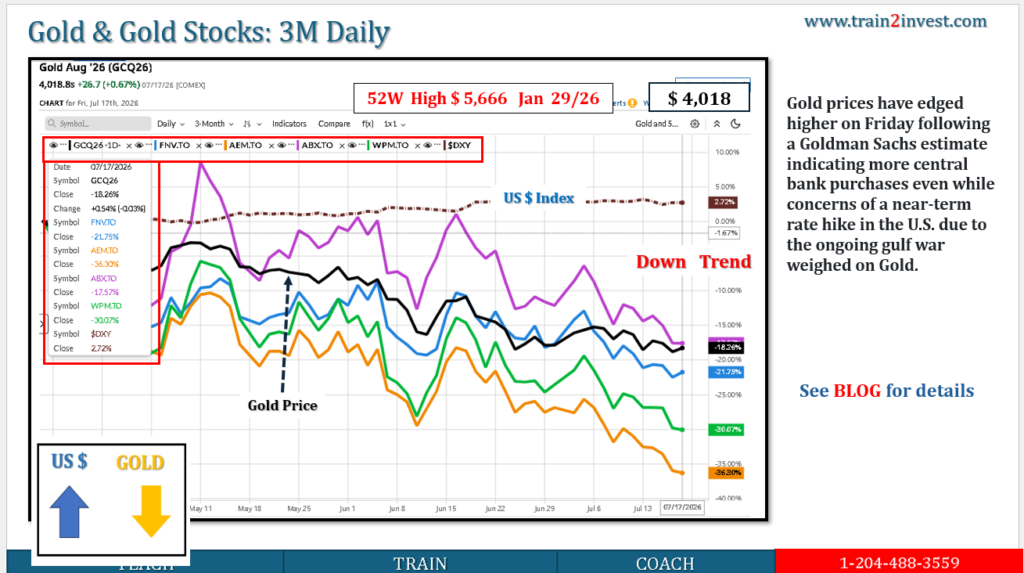
- The U.S.–Iran conflict and Strait of Hormuz disruption are the largest unscheduled risks, particularly for oil, inflation, gold and overall market volatility.
- The European Central Bank decision Thursday and global PMI data Friday could alter global bond yields and expectations for economic growth.
- Canadian manufacturing, wholesale and producer-price indicators Friday will provide secondary evidence on tariffs, industrial activity and input-cost inflation.
TSX Event Calendar: July 20–24, 2026
| Date | Event | Importance | Most exposed TSX sectors |
|---|---|---|---|
| Mon., July 20 | Canada CPI, June | Very high | Financials, REITs, utilities, technology, consumer discretionary |
| China loan prime rates | Medium | Materials, industrials, energy | |
| Middle East developments and oil opening | Very high | Energy, airlines, industrials, consumer sectors | |
| Tue., July 21 | U.S. state employment and weekly-earnings data | Low–medium | Broad TSX through U.S. yields |
| Canada transit and airport activity | Low | Industrials and transportation | |
| Wed., July 22 | U.S. Treasury 20-year bond auction | Medium | Technology, utilities, REITs, gold |
| EIA U.S. petroleum inventories | High | Energy | |
| Thu., July 23 | Canada retail sales, May | High | Consumer discretionary, staples, banks |
| ECB interest-rate decision | High | Global bond yields, financials, gold, technology | |
| U.S. weekly jobless claims | Medium | Broad market and rate expectations | |
| Fri., July 24 | Global flash manufacturing and services PMIs | High | Materials, energy, industrials, technology |
| U.S. new-home sales | Medium | Materials, forestry, industrials | |
| Canada producer and raw-material price indexes | High | Materials, energy, industrials | |
| Canada manufacturing and wholesale advance indicators | Medium–high | Industrials, autos, railways, banks | |
| Canada new-home and construction price indexes | Medium | REITs, banks, building-material companies |
1. Monday, July 20
Canada Consumer Price Index—June 2026
Statistics Canada is scheduled to release June CPI at 8:30 a.m. Eastern. It will also publish building investment, mineral-production, credit and energy-transportation data.
Potential TSX impact
| CPI outcome | Likely market response | Potential sector effect |
|---|---|---|
| Below expectations | Bond yields and CAD may decline; rate-cut expectations increase | Positive for REITs, utilities, technology and discretionary stocks |
| Near expectations | Limited market reaction | Stock-specific factors dominate |
| Above expectations | Bond yields and CAD may rise; rate cuts pushed back | Negative for REITs, utilities, technology and leveraged consumers |
| High CPI caused mainly by oil | Energy benefits, but broader valuations pressured | Mixed TSX result |
The important distinction will be between headline CPI and underlying inflation. An oil-driven headline increase may support TSX energy shares but still reduce the probability of future Bank of Canada easing.
China loan prime rates
Markets will assess whether China changes its benchmark lending rates. A rate reduction or stronger stimulus signal would generally support expectations for Chinese industrial demand.
TSX sensitivity:
- Positive: copper, base metals, fertilizers, forestry and industrial exporters
- Negative surprise: materials and China-sensitive cyclicals
U.S.–Iran conflict and Strait of Hormuz
The conflict intensified over the weekend after further U.S. strikes and Iranian attacks on Gulf-region targets. Shipping through the Strait of Hormuz has been disrupted, while oil prices have risen as the risk to regional energy infrastructure increases.
TSX transmission
Conflict escalation→higher oil→higher energy earnings
but also:higher oil→higher inflation→higher bond yields→lower equity multiples
| Potential beneficiaries | Potential pressure |
|---|---|
| CNQ, SU, IMO and other producers | Airlines and transportation |
| Pipelines, depending on volume expectations | Consumer discretionary |
| Gold shares during safe-haven buying | Utilities and REITs if yields rise |
| Canadian dollar | Manufacturing companies with energy-intensive costs |
This is likely to be the dominant geopolitical variable for the entire week.
2. Tuesday, July 21
U.S. regional employment and wage data
The U.S. Bureau of Labor Statistics is scheduled to release state employment and unemployment figures, along with second-quarter usual weekly earnings, at 10:00 a.m. Eastern.
These are not normally major TSX-moving releases, but an unexpected wage acceleration could reinforce inflation concerns and push U.S. Treasury yields higher.
TSX impact
- Higher yields: negative for technology, REITs, utilities and gold
- Strong employment: positive for economically sensitive companies, but potentially negative for rate-cut expectations
- Weak employment: initially negative for growth expectations but potentially supportive for bonds and rate-sensitive stocks
Canada transportation data
Statistics Canada is scheduled to release public-transit and airport-activity information.
The direct market impact should be limited, but the figures may provide background evidence for passenger demand, urban activity and transportation trends.
3. Wednesday, July 22
U.S. Treasury bond auction
The U.S. Treasury is expected to auction US$13 billion of 20-year bonds Wednesday. Weak demand could lift long-term yields; strong demand could lower them.
Why it matters to the TSX
Long-duration equities are particularly sensitive to Treasury yields:
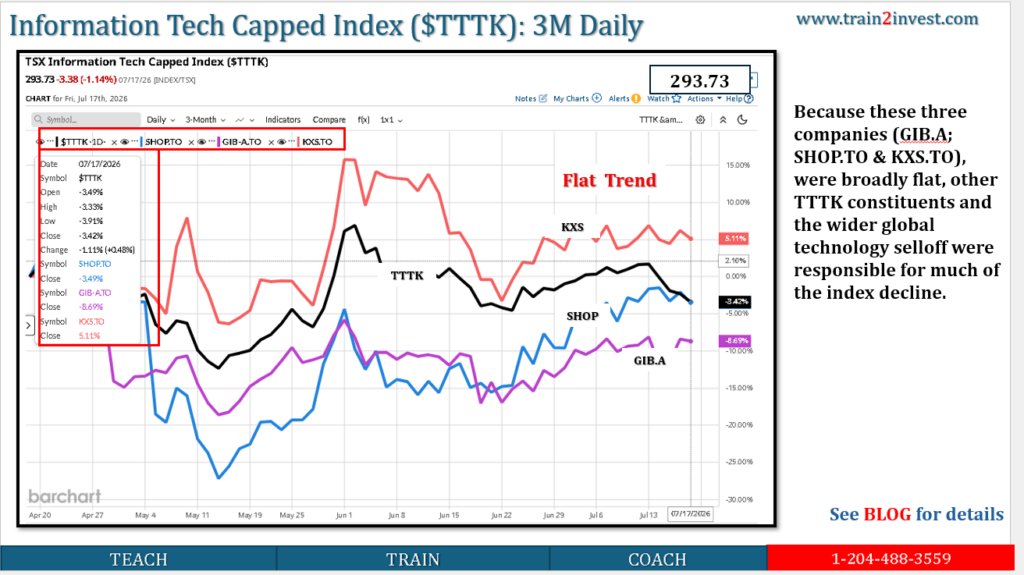
- Shopify and other technology shares
- Utilities
- REITs
- High-valuation consumer companies
- Gold and precious-metal equities
A poorly received auction could pressure these sectors even without any change in company fundamentals.
U.S. petroleum inventories
Weekly EIA petroleum data will be watched closely because the normal inventory signal is currently interacting with Middle East supply disruption.
| Inventory result | Likely implication |
|---|---|
| Large crude draw | Additional support for WTI and TSX energy |
| Large build | Could offset part of the geopolitical premium |
| Falling gasoline demand | Negative for refiners and demand expectations |
| Product shortages | Supportive for refining margins |
The geopolitical situation may dominate ordinary inventory data if shipping conditions deteriorate materially.
4. Thursday, July 23
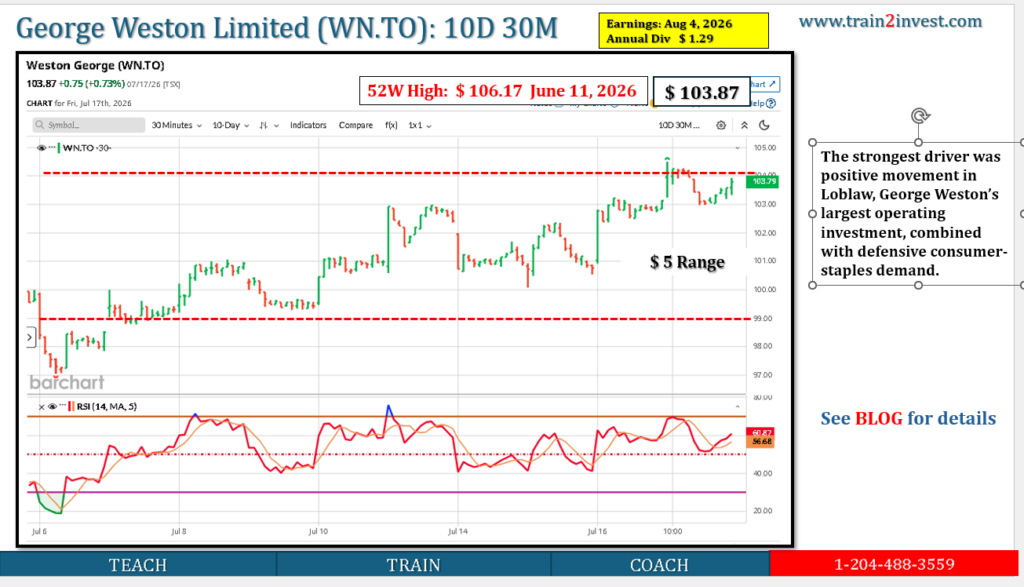
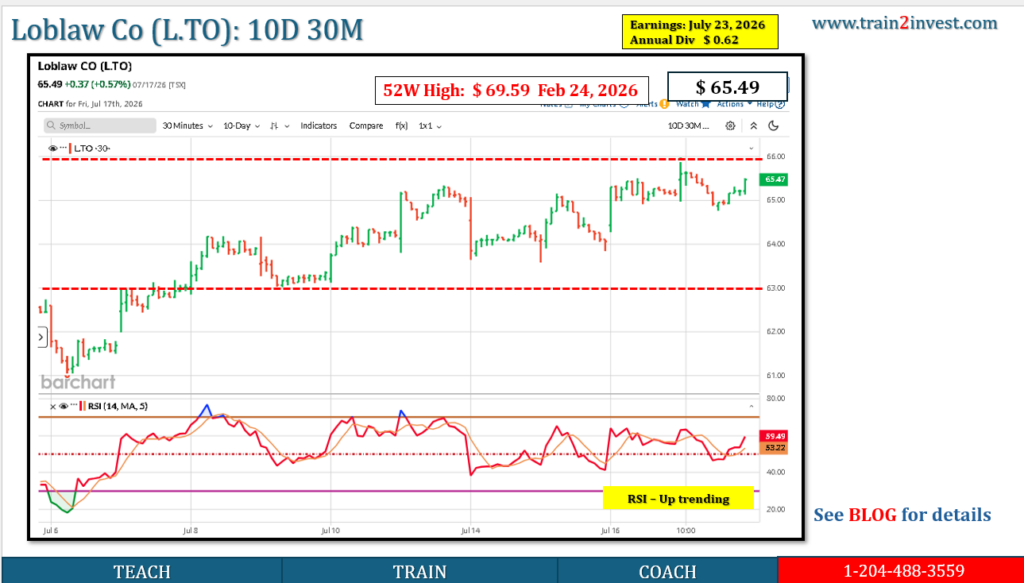
Canada retail sales—May 2026
Statistics Canada will release May retail trade at 8:30 a.m. Eastern, along with refined-petroleum and natural-gas statistics.
This is the week’s second-most important Canadian release after CPI.
Sector implications
| Retail-sales result | Likely beneficiaries | Likely pressure |
|---|---|---|
| Strong headline and volume growth | CTC.A, LNR indirectly, banks and consumer discretionary | Defensive retailers may lag |
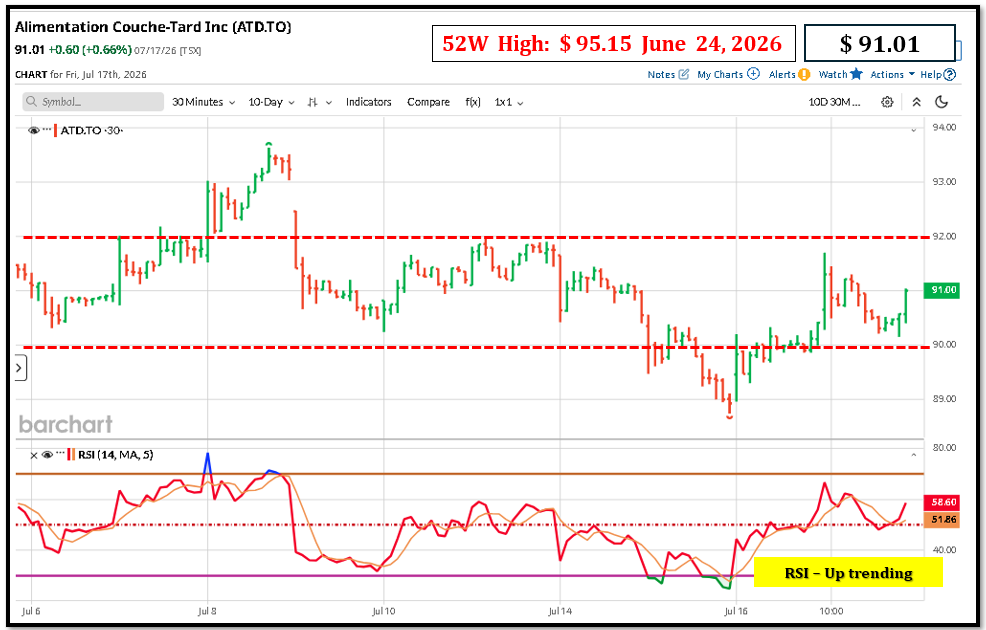
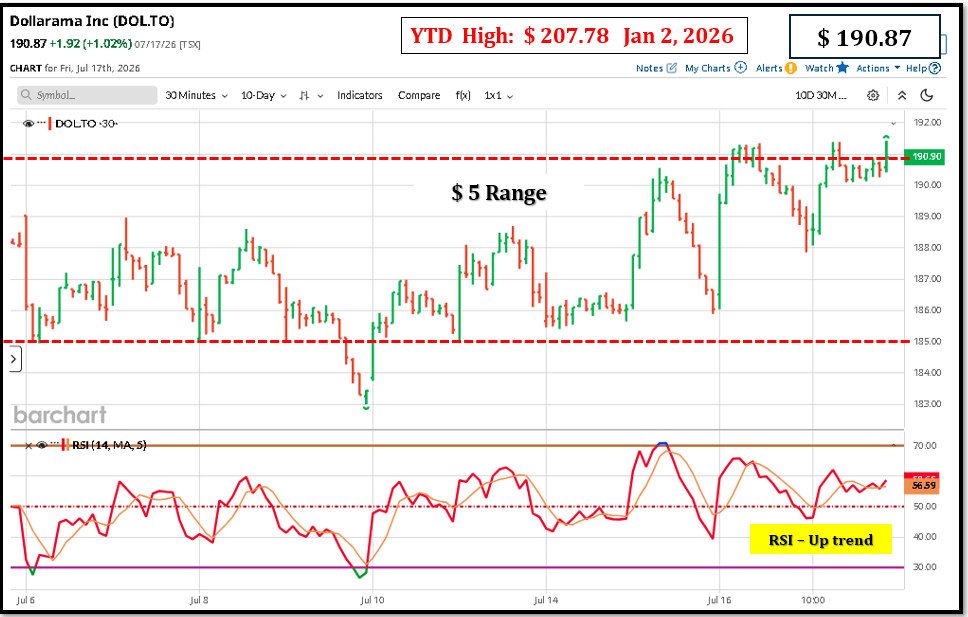
| Weak core retail sales | Dollarama and discount retailers may outperform relatively | Canadian Tire, apparel and discretionary retailers |
| Strong auto sales | Magna, Linamar and auto-related lenders | — |
| Weak gasoline volumes | Convenience retailers and refiners | Energy demand sentiment |
The volume measure matters more than nominal sales. Higher sales caused only by price increases do not necessarily indicate stronger consumer demand.
European Central Bank decision
The ECB’s monetary-policy meeting and press conference are scheduled for July 23. Economists broadly expect no immediate change, but higher energy prices have increased the possibility of a later rate increase.
TSX impact
- Hawkish ECB: global yields could rise; negative for technology, gold, utilities and REITs
- Dovish ECB: supportive for global equities and precious metals
- Strong euro reaction: may weaken DXY, potentially supporting gold and commodities
- Energy-inflation emphasis: reinforces the Middle East–inflation risk
U.S. weekly jobless claims
Claims will provide a timely reading on the U.S. labour market ahead of the July 29 Federal Reserve decision.
A sharp rise in claims could support rate-cut expectations but also increase recession concerns. The TSX reaction would therefore depend on whether investors focus on lower yields or weaker growth.
5. Friday, July 24
Global flash PMIs
Preliminary July purchasing-managers’ indexes for the United States, eurozone and United Kingdom are expected Friday. These reports will provide an early reading on manufacturing, services, orders, employment and input-price pressures.
TSX sensitivity
| PMI signal | Likely effect |
|---|---|
| Strong manufacturing and new orders | Positive for industrials, materials, energy and railways |
| Weak manufacturing | Negative for copper, steel, forestry and transportation |
| Strong services plus rising prices | Inflation concern; yields may rise |
| Weak services and manufacturing | Recession concern; defensive sectors may outperform |
The input-price components will be particularly important because markets are already assessing higher oil costs.
U.S. new-home sales
June new-home sales are scheduled for 10:00 a.m. Eastern.
The TSX exposure is mainly indirect:
- Forestry and lumber companies
- Building-material suppliers
- Railways
- Canadian banks with U.S. exposure
- Interest-rate-sensitive equities
Strong sales could support cyclical companies but also keep U.S. bond yields elevated.
Canadian producer and industrial data
Statistics Canada is scheduled to release:
- Industrial Product Price Index
- Raw Materials Price Index
- June manufacturing advance indicator
- June wholesale advance indicator
- New Housing Price Index
- Second-quarter building-construction price indexes
Key interpretation
| Release | Main TSX relevance |
|---|---|
| Raw-material prices | Energy and mining revenue; inflation pressure |
| Industrial product prices | Manufacturing margins and pricing power |
| Manufacturing advance estimate | Autos, industrials, railways and banks |
| Wholesale estimate | Broader domestic demand |
| New-home prices | Banks, REITs and construction-related companies |
| Construction costs | Infrastructure margins and real-estate development |
Rising raw-material prices are positive for commodity producers but negative for companies unable to pass costs through to customers.
Geopolitical Risks to Monitor All Week
1. Strait of Hormuz and broader Gulf conflict — highest risk
Watch for:
- Further reductions in tanker traffic
- Damage to oil, LNG, power or desalination infrastructure
- Expansion into the Red Sea
- U.S. or Iranian indications of negotiations
- Strategic petroleum reserve releases
- Insurance and freight-rate increases
TSX direction: positive for energy initially; negative for the broad index if oil inflation pushes yields sharply higher.
2. Canada–U.S. trade and USMCA uncertainty
The United States declined to extend the North American trade agreement during its formal review, while existing tariffs on Canadian autos, metals and lumber remain major points of dispute.
Exposed TSX groups
- Magna and Linamar
- Steel and aluminum producers
- Forestry companies
- Railways
- Industrials
- Canadian dollar
- Banks through business-credit exposure
Any announcement of sector exemptions or negotiations would be positive. Additional tariffs or retaliatory measures would be negative.
3. OPEC+ supply response
OPEC+ approved an additional August production increase, while OPEC also reduced its 2026 oil-demand-growth forecast.
This creates opposing forces:More OPEC+ supply→lower oil pressure
versus:Hormuz disruption→higher oil pressure
The ability to transport oil may be more important than stated production targets while the strait remains disrupted.
Priority Ranking
| Rank | Event or risk | Expected TSX relevance |
|---|---|---|
| 1 | U.S.–Iran conflict and Strait of Hormuz | Energy, inflation, gold and broad risk sentiment |
| 2 | Canada CPI—Monday | BoC expectations, yields, CAD and rate-sensitive sectors |
| 3 | Canada retail sales—Thursday | Consumer companies and banks |
| 4 | ECB decision—Thursday | Global yields, currencies and gold |
| 5 | Global PMIs—Friday | Materials, energy and industrial growth expectations |
| 6 | Canada producer/manufacturing data—Friday | Industrial margins and domestic activity |
| 7 | Canada–U.S. trade developments | Autos, metals, forestry and industrials |
| 8 | U.S. housing and labour indicators | Secondary yield and growth effects |
Actionable Takeaways
The week’s TSX direction will likely depend on the interaction of three forces:Canadian inflation+Middle East oil risk+global bond yields
- Energy could rise while the broader TSX falls if escalating conflict pushes both oil and bond yields higher.
- A soft Canadian CPI report could support REITs, utilities, technology and consumer discretionary shares.
- Weak retail sales would favour defensive staples relative to discretionary companies.
- Friday’s PMI and Canadian producer-price data will show whether higher energy costs are beginning to weaken growth while raising inflation.