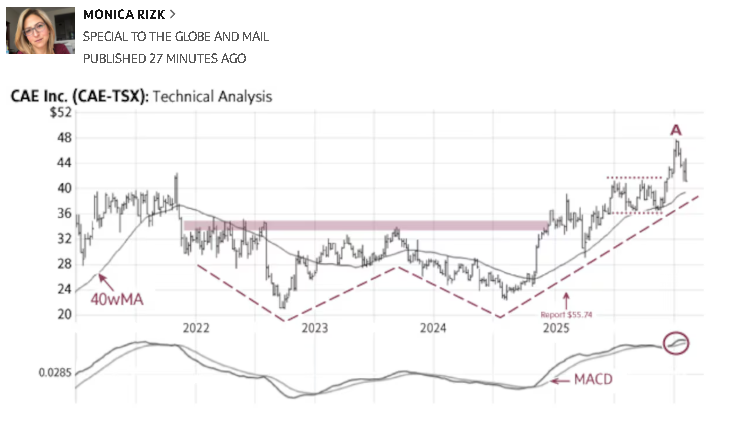
CAE (CAE-T +0.97%increase, Friday’s close $41.20) formed a bullish technical base in the shape of a “W” pattern (dashed lines). On March 13, 2025, at $34.18, we identified a breakout above the neckline of this formation (shaded area) and provided an initial upside target of $43. The stock subsequently advanced to a July high of $41.22 (A) before consolidating within a narrow range between $36 and $41 (dotted lines). The recent rise above this consolidation range signals a fresh breakout, completes and exceeds our previously identified target, and confirms the continuation of the longer-term uptrend (B).
Technical indicators, including the rising 40-week moving average (40wMA), continue to support the bullish outlook. Only a sustained decline below the $39 area would be viewed as negative.
Point & Figure measurements provide a target of $52.
The large “W” pattern (dashed lines) continues to support higher targets.
Leave a Reply
You must be logged in to post a comment.