Executive Summary
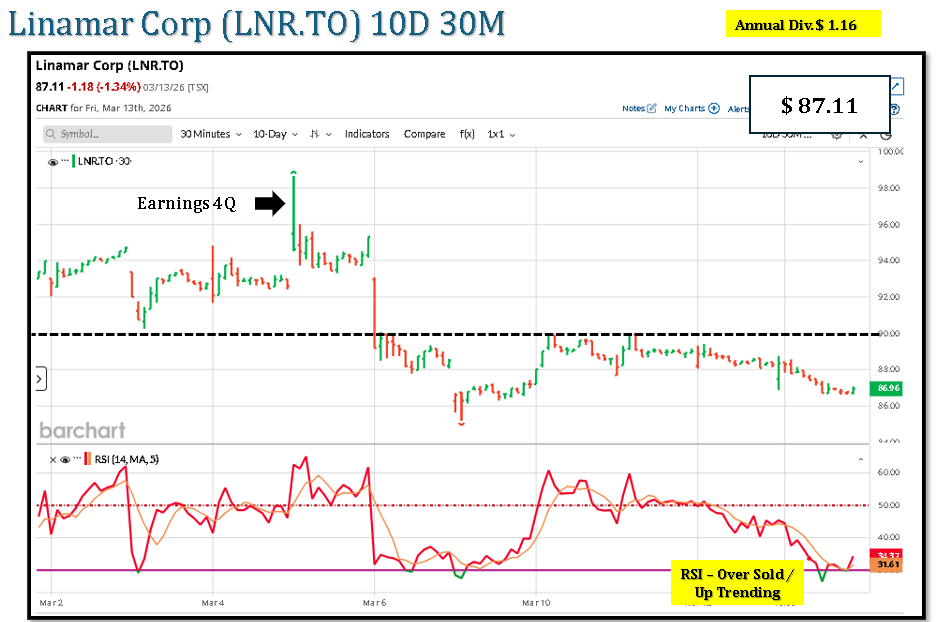
- Linamar (LNR.TO) has been volatile over the last ~10 trading days, trading roughly ~C$88–C$95, reflecting consolidation after a strong 12-month rally.
- The decline primarily reflects profit-taking near analyst target prices and sector cyclicality, not a fundamental earnings shock.
- Technical range: key support C$88–90, resistance C$95–98.
- Analyst consensus: average 12-month target ~C$94–96, with high ~C$103 and low ~C$85.
- Near-term outlook is range-bound unless auto production or industrial segment outlook changes.
1. What Drove the Share Price Decline (Last ~10 Trading Days)
Observed price movement
| Date (recent sample) | Close (CAD) | Daily Change |
|---|---|---|
| Feb 13 | 94.91 | +5.48% |
| Feb 12 | 89.98 | -1.23% |
| Feb 11 | 91.10 | +1.61% |
| Feb 10 | 89.66 | +1.09% |
| Feb 9 | 88.69 | +0.12% |
Source: TSX historical price data.
Interpretation
- Profit-taking after strong rally
- Stock up ~66–72% over the last 12 months, creating short-term technical overextension.
- Traders typically trim positions near prior highs (~C$95–98).
- Valuation compression near analyst targets
- The share price is very close to the consensus analyst target (~C$94.83).
- When price converges with target, momentum investors often exit.
- Mixed segment outlook
- Management expects double-digit growth in the Mobility segment, but Industrial segment sales and earnings are projected to decline, creating earnings uncertainty.
- Auto supply chain cyclicality
- Linamar’s revenue is highly tied to global vehicle production volumes; short-term macro data and auto demand expectations can move the stock even without company-specific news.
2. Key Technical Levels
Based on recent trading ranges and prior highs.
| Level | Price (CAD) | Interpretation |
|---|---|---|
| Major Resistance | 98–100 | Prior 52-week high (~98.65) |
| Near-term Resistance | 94–95 | Area where rallies stall |
| Pivot / Fair Value | 91–92 | Average recent trading zone |
| Near Support | 88–90 | Recent bounce zone |
| Major Support | 83–85 | Lowest analyst target |
52-week range: C$43.84 – C$98.65.
3. Analyst Forecasts (Forward Outlook)
Consensus Targets
| Metric | CAD |
|---|---|
| Average target | 94.83–95.54 |
| High estimate | 103 |
| Low estimate | 85–86 |
| Analyst rating | Buy / Moderate Buy |
Sources: analyst consensus data.
4. Scenario Analysis
3-Month Outlook (short-term)
| Scenario | Price Range | Drivers |
|---|---|---|
| Bear | 85–88 | Global auto production slowdown, industrial segment weakness |
| Base | 88–95 | Range-bound consolidation near fair value |
| Bull | 95–100 | Strong auto build rates or margin expansion |
Probability bias: Base scenario most likely because price already reflects current analyst targets.
12-Month Outlook
| Scenario | Price Range | Key Drivers |
|---|---|---|
| Bear | 80–85 | Auto cycle downturn, industrial segment deterioration |
| Base | 95–103 | Earnings growth in mobility segment + stable margins |
| Bull | 105–110 | EV component growth, higher global vehicle production |
Consensus aligns closest to ~95–100 range.
5. Valuation Context
| Metric | Value |
|---|---|
| Market cap | ~C$5.7B |
| P/E (TTM) | ~22.5 |
| Dividend yield | ~1.2% |
| Beta | ~1.30 |
Interpretation:
- Valuation slightly above auto-components industry average on P/E terms.
- Growth expectations from mobility segment justify premium, but limit upside if earnings slow.
6. Key Risks to the Outlook
Macro
- Global auto production slowdown
- North American vehicle demand decline
- Interest-rate sensitive consumer spending
Company-specific
- Industrial segment revenue contraction
- Execution risk in EV component transition
- Margin pressure from OEM pricing negotiations
Market
- Stock already near analyst target → limited upside unless estimates rise.
7. What Would Disprove the Base Case
The neutral outlook would change if:
- Auto production forecasts materially rise (North America or Europe).
- Linamar announces major EV supply contracts.
- Industrial segment declines faster than expected.
These would respectively shift the stock toward bull (>100) or bear (<85) ranges.
✅ Bottom line:
The recent 10-day pullback in LNR is mostly technical consolidation after a strong rally and proximity to analyst price targets, not a fundamental deterioration. Current data supports a short-term trading band ~C$88–95, with 12-month consensus upside limited to roughly ~C$95–103 unless earnings estimates are revised upward.
Leave a Reply
You must be logged in to post a comment.