Executive Summary
- Saputo (SAP.TO) has declined slightly over the last ~10 trading days mainly due to technical consolidation after a strong multi-month rally (~70% over 12 months).
- The pullback also reflects mixed earnings signals: EPS beat expectations but revenue missed forecasts in the latest quarter.
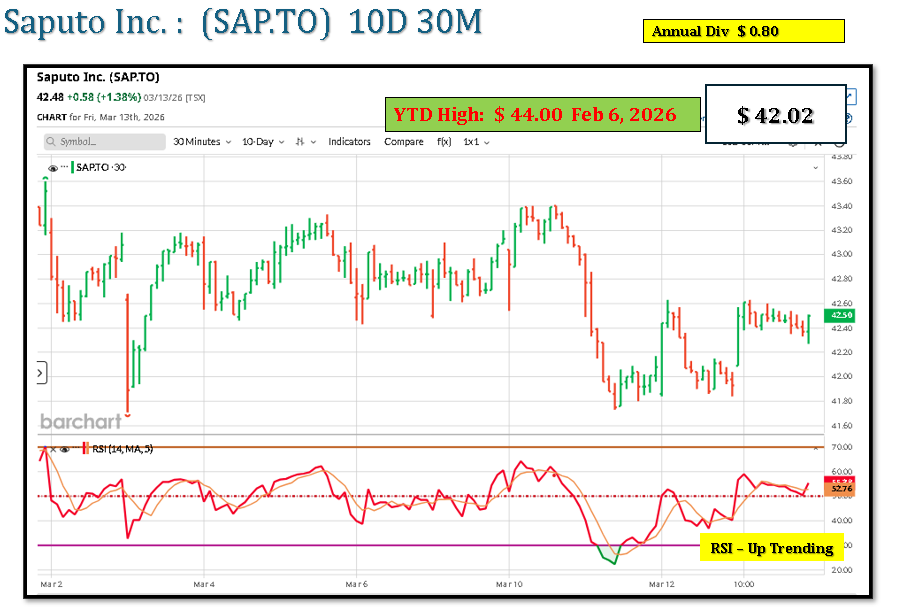
- Technical levels indicate support around C$41–42 and resistance near C$44.
- Analyst consensus implies limited upside, with a 12-month target around C$44–45 from a current price near ~C$42.
- Short-term outlook: range-bound consolidation, unless earnings estimates are revised.
1. Drivers of the Recent Share Price Decline (Last ~10 Days)
1. Profit-Taking After Strong Rally
Saputo shares have risen ~70% over the past year, bringing the stock near its 52-week high (~C$44).
When a stock rallies rapidly:
- institutional investors often reduce exposure
- short-term traders lock in gains
This creates temporary downward pressure even if fundamentals remain stable.
2. Mixed Earnings Signals
Recent quarterly results showed:
| Metric | Result |
|---|---|
| Adjusted EPS | C$0.57 (beat forecast) |
| Revenue | C$4.9B (missed expectations) |
Revenue missed forecasts by roughly 2% YoY, despite earnings beating estimates.
Implication:
- margins improved
- sales growth was weaker than expected
Markets typically react cautiously to revenue misses.
3. Valuation Near Analyst Targets
Current pricing is close to consensus valuation.
| Metric | CAD |
|---|---|
| Current price | ~C$42 |
| Avg 12-month target | ~C$44.6 |
| High target | ~C$52 |
| Low target | ~C$27 |
Because the stock is already near fair value, buying momentum tends to fade.
2. Technical Structure
Key Support and Resistance
| Level | Price (CAD) | Interpretation |
|---|---|---|
| Major resistance | 44–45 | Near 52-week high |
| Near resistance | 43–44 | Recent rally peak |
| Pivot | 42 | Current trading area |
| Near support | 41–42 | Short-term technical support |
| Major support | 39–40 | Previous breakout zone |
Technical indicators currently show neutral-to-positive momentum, with price still above major moving averages.
3. Fundamentals Driving the Medium-Term Outlook
Key earnings drivers for Saputo:
| Driver | Impact |
|---|---|
| Dairy pricing | Revenue volatility |
| Input costs (milk, energy) | Margin pressure |
| Operational efficiency programs | Margin expansion |
| Global demand for dairy | Volume growth |
Recent restructuring and cost-efficiency initiatives have improved margins and EBITDA growth.
However, revenue growth expectations remain modest.
4. Scenario Analysis
3-Month Outlook
| Scenario | Price Range | Drivers |
|---|---|---|
| Bear | 39–41 | weaker dairy demand or TSX risk-off |
| Base | 41–44 | consolidation after rally |
| Bull | 44–47 | earnings upgrades or margin expansion |
Probability: Base scenario most likely given price near consensus target.
12-Month Outlook (Analyst-Based)
| Scenario | Price Range | Drivers |
|---|---|---|
| Bear | 36–39 | margin compression or weaker global dairy demand |
| Base | 43–46 | moderate earnings growth |
| Bull | 48–52 | stronger pricing and operating leverage |
Consensus suggests ~5–10% upside from current levels.
5. Key Risks
Operational
- dairy commodity price volatility
- weak demand in key markets (North America / Europe)
Financial
- margin pressure from milk input costs
Market
- valuation compression after strong rally
6. What Would Change the Outlook
Bullish revision triggers:
- sustained dairy price increases
- stronger revenue growth in international markets
- continued margin expansion
Bearish triggers:
- declining dairy demand
- higher input costs
- earnings miss on revenue.
✅ Bottom line:
Saputo’s recent 10-day decline is primarily technical consolidation after a large 12-month rally and mixed revenue results, not a fundamental deterioration. Current data supports a short-term trading range of roughly C$41–44, with analyst-based 12-month valuation around C$44–46 unless earnings estimates rise materially.
Leave a Reply
You must be logged in to post a comment.