Executive Summary
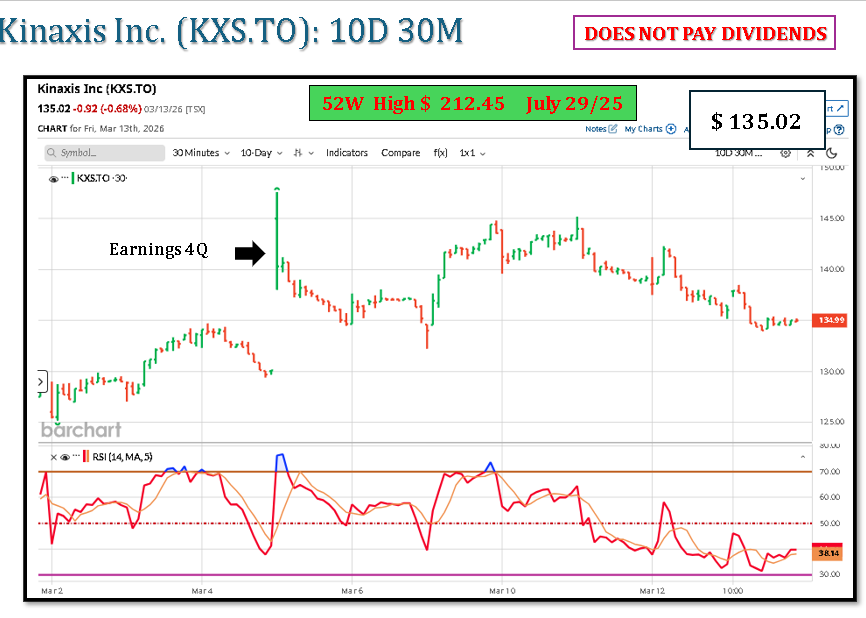
- Kinaxis (TSX: KXS) has been volatile over the past ~10 days as part of a broader sell-off in software and AI-related tech stocks, not due to a single fundamental event.
- The stock has already declined ~25–28% over the past month, reflecting valuation compression in high-multiple software names.
- Investor concerns include AI competition, margin expectations, and slower near-term growth versus previous forecasts.
- Analysts still maintain Buy / Strong Buy ratings, with average 12-month price targets around C$210–C$220.
- Short-term outlook: high volatility and consolidation, but analysts still expect significant upside if growth targets are met.
1. Drivers of the Share Price Movement (Last ~10 Days)
1. Broader Software Sector Repricing
KXS has been caught in a global software sector repricing driven by:
- higher discount rates
- AI disruption fears
- rotation from growth to value
Kinaxis experienced a ~28% decline over the past month despite stable earnings, indicating the move is largely sentiment-driven rather than fundamental.
2. Reduced Analyst Price Targets
Some banks lowered targets slightly despite maintaining Buy ratings.
Example:
- BMO lowered its price target from C$225 to C$180, citing sector volatility while maintaining a positive outlook.
Lower targets often trigger short-term algorithmic selling.
3. Growth Expectations vs Execution Risk
Kinaxis remains a high-growth supply-chain software company, but investors are reassessing how quickly AI products will generate revenue.
The company expects 2026 revenue of about US$620–635M, which investors are using as a benchmark for growth expectations.
If revenue growth slows relative to expectations, high-valuation software stocks often decline quickly.
4. High Valuation Sensitivity
Typical valuation profile:
| Metric | Approximate Level |
|---|---|
| P/E | ~80× |
| Market cap | ~C$3–4B |
High-multiple SaaS stocks typically experience larger drawdowns during tech corrections.
2. Technical Structure
Approximate key levels derived from recent price ranges.
| Level | Price (CAD) | Interpretation |
|---|---|---|
| Major resistance | 170–175 | previous breakdown area |
| Near resistance | 160–165 | short-term supply zone |
| Pivot | 145–150 | recent consolidation |
| Near support | 130–135 | recent lows |
| Major support | 120–125 | 52-week support |
Technical indicators currently show sell signals across multiple moving averages, indicating weak momentum.
3. Analyst Forecasts
Consensus rating
- Rating: Buy / Strong Buy
- Coverage: ~6–11 analysts
Price targets
| Metric | CAD |
|---|---|
| Average target | ~C$210–220 |
| High estimate | ~C$245–252 |
| Low estimate | ~C$136–200 |
This implies ~40–70% potential upside depending on entry price.
4. Scenario Analysis
3-Month Outlook
| Scenario | Price Range | Drivers |
|---|---|---|
| Bear | 120–130 | continued tech sell-off |
| Base | 130–160 | consolidation after sharp decline |
| Bull | 160–180 | software sector recovery |
Most likely: volatile consolidation.
12-Month Outlook (Analyst-Based)
| Scenario | Price Range | Drivers |
|---|---|---|
| Bear | 120–150 | growth slowdown or SaaS multiple compression |
| Base | 200–220 | execution on revenue growth |
| Bull | 230–250 | stronger enterprise demand for supply-chain software |
Consensus price targets cluster near ~C$210–220.
5. Fundamental Drivers
Kinaxis growth drivers:
| Driver | Impact |
|---|---|
| enterprise supply-chain digitization | long-term demand |
| AI-driven planning tools | product expansion |
| subscription revenue growth | margin stability |
Analysts expect:
- ~12–13% revenue growth annually
- ~30% EPS growth annually.
6. Key Risks
Technology
- AI competition from larger enterprise software firms
Valuation
- high SaaS multiples
Execution
- slower enterprise adoption
Market
- tech sector volatility.
7. What Would Change the Outlook
Bullish catalysts
- faster AI product adoption
- stronger enterprise contract growth
- software sector multiple expansion.
Bearish catalysts
- weaker subscription growth
- tech sector correction
- earnings miss.
✅ Bottom line:
The recent ~10-day movement in KXS.TO is part of a larger correction in high-growth software stocks, not a collapse in Kinaxis’ underlying business. The stock is currently consolidating near support (~C$130–145), while analyst targets remain much higher (~C$210–220) if growth expectations are achieved.
Leave a Reply
You must be logged in to post a comment.