Royal Bank of Canada (TSX: RY) — Fundamental & Technical Review
Executive Summary
- Market capitalization: ~C$320B, the largest bank in Canada and among the largest globally.
- Profitability: Net income ~C$20.4B in FY2025 with ~16% ROE, reflecting strong earnings growth and scale.
- Dividend: ~C$6.56 annual dividend (~2.8% yield), with a 10+ year record of growth.
- Valuation: ~16× P/E and ~2.6× price-to-book, consistent with premium Canadian bank valuation.
- 6-month outlook: Base case range C$230–260, driven by earnings growth and rate-cycle expectations.
1. Fundamental Analysis
Business Model
Royal Bank of Canada (RBC) is a diversified universal bank with major segments:
| Segment | Core Activities |
| Personal & Commercial Banking | Canadian mortgages, loans, deposits |
| Wealth Management | Investment advisory, asset management |
| Capital Markets | Investment banking, trading |
| Insurance | Insurance products |
| Investor & Treasury Services | Custody and institutional services |
Key strength: diversified earnings mix, reducing dependence on any single segment.
Recent earnings growth has been driven by wealth management inflows, capital markets activity, and strong Canadian retail banking margins.
Financial Performance (Last 3 Fiscal Years)
CAD billions
| Fiscal Year | Revenue | Net Profit | Notes |
| 2023 | ~49.7 | ~14.9 | Post-pandemic normalization |
| 2024 | ~55.7 | ~16.9 | Loan growth, wealth management |
| 2025 | ~62.2 | ~20.4 | Record profit, ROE ~16% |
Key takeaway:
Profit growth is accelerating, driven by higher interest income and stronger capital markets.
Dividend Profile
| Metric | Value |
| Annual dividend | ~C$6.56 per share |
| Dividend yield | ~2.8% |
| Quarterly dividend | ~C$1.64 |
| Dividend growth | ~10+ years of increases |
| Payout ratio | ~40–45% |
Interpretation:
- Payout ratio leaves room for dividend growth
- Dividend growth historically tracks earnings growth
Market Capitalization
| Metric | Value |
| Market capitalization | ~C$320B |
| Shares outstanding | ~1.4B |
2. Valuation
| Metric | RBC | Interpretation |
| P/E | ~16× | Slight premium to banks |
| Price/Book | ~2.6× | Reflects strong ROE |
| Net margin | ~32% | Among highest globally |
| EPS (TTM) | ~14.07 | Growing rapidly |
Premium valuation reflects:
- dominant domestic franchise
- strong capital markets
- high ROE
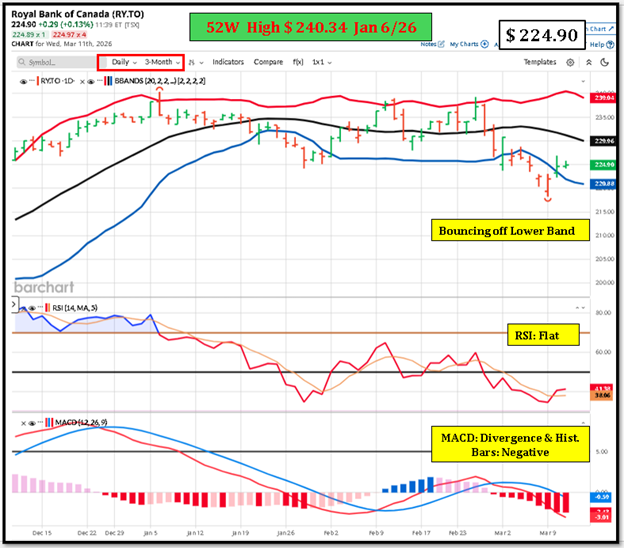
3. Technical Analysis
Current range (2026):
| Metric | Level |
| Current price | ~C$226–232 |
| 52-week high | ~C$240 |
| 52-week low | ~C$151 |
Trend
- Strong uptrend through 2025
- Consolidation near highs
Support levels
- C$210 (major institutional support)
- C$200 (psychological level)
Resistance levels
- C$240 (recent high)
- C$260 (next technical breakout zone)
Momentum remains neutral-bullish.
4. Key Drivers (Next 6 Months)
Macro
- Bank of Canada rate path
- Rate cuts can compress margins but stimulate loan growth.
- Canadian housing market
- RBC has large mortgage exposure.
- Capital markets activity
- M&A and trading revenue affect quarterly earnings.
- Wealth management flows
- Strong equity markets increase AUM.
5. Risks
| Risk | Impact |
| Housing downturn | Higher loan losses |
| Credit cycle deterioration | Higher provisions |
| Interest rate compression | Net interest margin decline |
| Regulatory changes | Capital requirements |
| Global recession | Capital markets revenue drop |
Loan loss provisions are the main cyclical risk for banks.
6. Scenario Forecast (6 Months)
| Scenario | Price Target | Drivers |
| Bear | C$210 | Credit losses rise, TSX correction |
| Base | C$240–250 | Earnings growth + stable economy |
| Bull | C$260–275 | Strong capital markets and wealth flows |
Analyst consensus 1-year target around ~C$245 supports the base scenario.
7. Investment Quality Assessment
| Factor | Assessment |
| Balance sheet | Very strong |
| Earnings stability | High |
| Dividend reliability | High |
| Market dominance | Leading |
| Cyclicality | Moderate |
Overall quality: Tier-1 global bank franchise
Strength comes from scale, diversification, and high ROE.
Actionable Takeaways
- RBC remains one of the highest-quality financial franchises in Canada.
- Earnings growth is strong and dividends are well covered.
- Valuation reflects this quality, trading at a premium to most Canadian banks.
- Near-term price movement likely tied to rate expectations and credit conditions.
Canadian Bank Peer Comparison
Royal Bank of Canada vs Major TSX Banks
Peers:
- Royal Bank of Canada (RY.TO)
- Toronto-Dominion Bank (TD.TO)
- Bank of Montreal (BMO.TO)
- Bank of Nova Scotia (BNS.TO)
- Canadian Imperial Bank of Commerce (CM.TO)
The objective is to determine whether RBC’s premium valuation is justified relative to Canadian bank peers.
Executive Summary
- RBC leads Canadian banks in market capitalization, profitability, and earnings diversification.
- RBC generates higher ROE (~16%) than most peers, justifying its valuation premium.
- Dividend yield is lower than peers, reflecting stronger growth rather than income focus.
- Capital markets and wealth management exposure give RBC higher earnings resilience in rising markets.
- 6-month base case: C$240–250, with upside if financial conditions remain supportive.
Peer Financial Comparison
Key Metrics (Approximate FY2025 data)
| Bank | Market Cap (CAD B) | Revenue (CAD B) | Net Income (CAD B) | ROE | Dividend Yield |
| RBC (RY) | ~320 | ~62 | ~20.4 | ~16% | ~2.8% |
| TD | ~155 | ~53 | ~11.5 | ~13% | ~4.7% |
| BMO | ~120 | ~45 | ~7.8 | ~11% | ~4.9% |
| BNS | ~82 | ~35 | ~8.0 | ~12% | ~6.2% |
| CIBC | ~78 | ~30 | ~6.3 | ~12% | ~5.5% |
Interpretation
RBC dominates in:
- profitability
- earnings diversification
- scale
BNS and CIBC offer higher yields but lower growth and higher risk exposure.
Valuation Comparison
| Bank | P/E | Price/Book | Comment |
| RBC | ~16x | ~2.6x | Premium valuation |
| TD | ~13x | ~1.6x | Regulatory overhang |
| BMO | ~12x | ~1.3x | Integration of Bank of the West |
| BNS | ~11x | ~1.2x | Emerging market exposure |
| CIBC | ~11x | ~1.3x | Mortgage exposure |
Key Insight
RBC trades at ~20–40% valuation premium due to:
- higher ROE
- stronger capital markets franchise
- superior earnings stability
Dividend Comparison
| Bank | Annual Dividend | Yield | Payout Ratio |
| RBC | ~$6.56 | ~2.8% | ~43% |
| TD | ~$4.16 | ~4.7% | ~50% |
| BMO | ~$6.20 | ~4.9% | ~50% |
| BNS | ~$4.24 | ~6.2% | ~60% |
| CIBC | ~$3.96 | ~5.5% | ~55% |
Interpretation
- RBC = lower yield, stronger growth
- BNS / CIBC = higher yield, slower growth
Structural Strengths of RBC
1. Diversified Earnings
Approximate revenue mix:
| Segment | Contribution |
| Canadian banking | ~40% |
| Wealth management | ~25% |
| Capital markets | ~25% |
| Insurance & others | ~10% |
This diversification reduces earnings volatility relative to mortgage-heavy peers.
2. Wealth Management Scale
RBC wealth assets under management exceed $1.3 trillion, among the largest globally.
Benefit:
- fee-based revenue
- lower capital intensity
- higher margins
3. Capital Markets Franchise
RBC Capital Markets is consistently ranked among the top global investment banks outside the US.
This segment significantly boosts earnings during strong markets.
Technical Analysis (RY.TO)
Current structure (approximate):
| Indicator | Level |
| Current price | ~C$228–232 |
| 50-day MA | ~C$224 |
| 200-day MA | ~C$208 |
| Trend | Uptrend |
Key Levels
Support:
- C$220
- C$210
Resistance:
- C$240
- C$260
Trend remains constructively bullish.
Key Drivers (Next 6 Months)
Positive Drivers
- Canadian economic stability
- Strong capital markets revenues
- Wealth inflows
- Bank of Canada easing cycle
Negative Drivers
- Housing correction
- Credit losses
- Global recession
- Interest margin compression
Scenario Forecast (6 Months)
| Scenario | Price | Drivers |
| Bear | C$210 | credit losses rise |
| Base | C$240–250 | stable earnings growth |
| Bull | C$260–275 | strong markets + earnings beat |
What Would Disprove the Bullish Thesis
The investment case weakens if:
- loan loss provisions rise sharply
- Canadian housing deteriorates
- capital markets revenues decline materially
- ROE falls below 14%
Investment Quality Assessment
| Category | Rating |
| Balance Sheet | Very Strong |
| Profitability | Best among Canadian banks |
| Earnings Stability | High |
| Dividend Reliability | High |
| Growth Potential | Moderate-High |
Overall classification: High-quality financial franchise.
Actionable Takeaways
- RBC trades at a premium valuation because it is the highest-quality bank in Canada.
- Dividend yield is lower but earnings growth and ROE are superior.
- The stock is technically in an uptrend with resistance near C$240.
- Over the next 6 months, the most probable trading range is C$230–250.
Top Analyst Forecasts — Royal Bank of Canada (TSX: RY)
Below are five widely cited institutional analyst price targets compiled from brokerage reports and analyst aggregators. These are generally 12-month targets, but they provide a reasonable basis for estimating a 6-month trajectory.
Current price reference: ~C$231–234
Executive Summary
- Consensus analyst view: Moderately bullish on RY.
- Average target: ~C$235–243.
- High target: ~C$260–270.
- Low target: ~C$189–220.
- Implied 6-month trading range: C$220–255 assuming stable macro conditions.
Analyst surveys indicate 8 Buy, 2 Hold, 2 Strong Buy ratings across coverage firms.
Top 5 Analyst Price Targets
| Analyst / Firm | Rating | Price Target (CAD) | Implied Upside | Key Thesis |
| Canaccord Genuity | Buy | C$255 | ~10% | Strong capital markets earnings |
| National Bank Financial | Outperform | C$231 | ~0–3% | Stable retail banking growth |
| Raymond James | Outperform | C$229 | ~0% | Premium valuation justified |
| Jefferies | Hold | C$215 | ~-7% | Valuation concerns |
| Consensus (11 analysts) | Buy | C$234–243 | ~2–5% | Balanced outlook |
Analyst Target Distribution
| Statistic | Price (CAD) |
| Highest forecast | ~C$260–270 |
| Average forecast | ~C$235–243 |
| Lowest forecast | ~C$189–220 |
The consensus estimate implies limited upside from current levels, indicating analysts believe the stock is close to fair value.
Translating Analyst Targets to a 6-Month Forecast
Analyst targets typically reflect 12-month expectations, so a rough midpoint adjustment gives:
| Scenario | 6-Month Price Estimate |
| Bear | C$210–220 |
| Base | C$235–245 |
| Bull | C$250–260 |
Drivers:
- EPS growth ~8–10% expected in FY2026
- stable Canadian credit environment
- capital markets revenue strength
Key Variables Analysts Are Watching
Positive
- wealth management inflows
- capital markets trading revenues
- Bank of Canada rate stability
Negative
- credit losses from mortgages
- housing slowdown
- margin compression if rate cuts accelerate
What Would Change Analyst Targets
Targets could be revised upward if:
- ROE rises above 17%
- capital markets revenues outperform
- Canadian housing remains resilient
Targets could fall if:
- loan loss provisions increase
- economic growth weakens materially
Actionable Takeaways
- Analyst consensus suggests limited near-term upside but high stability.
- RBC trades near fair value according to most broker models.
- The stock is widely viewed as a quality defensive bank rather than a high-growth opportunity.
Leave a Reply
You must be logged in to post a comment.