Updated 3-Month Forecast (mid-April to mid-July 2026) for Canadian Big 6 Banks (TSX-listed).
Current approximate prices (as of approx.. April 16, 2026): TD.TO $142 CAD, RY.TO $240 CAD, BMO.TO $204 CAD, BNS.TO $103 CAD, NA.TO $201 CAD, CM.TO $147 CAD.
Sector setup remains similar: Q1 2026 earnings were strong across the board (all banks beat estimates, collective $$19B profit, driven by revenue/wealth/capital markets strength, stable credit). Valuations are elevated after the 2025 rally and continued gains into 2026, with most stocks trading near or above consensus 12-month targets. Limited upside overall, range-bound trading likely, with dispersion based on U.S. exposure, yield, and domestic vs. international mix.
Consensus view: Banks near peak multiples; forward returns compressed. Earnings growth mid-single digits expected. Rate path, consumer/housing credit, and loan growth are key watchpoints.
3-Month Forecast (Range + Bias)
| Ticker | Direction | 3M Range (CAD) | Basis |
| TD.TO | Flat to slight down | 135–148 | Trading near/above most targets ($C$139–142 consensus). Strong Q1 but already re-rated; U.S. exposure adds volatility. |
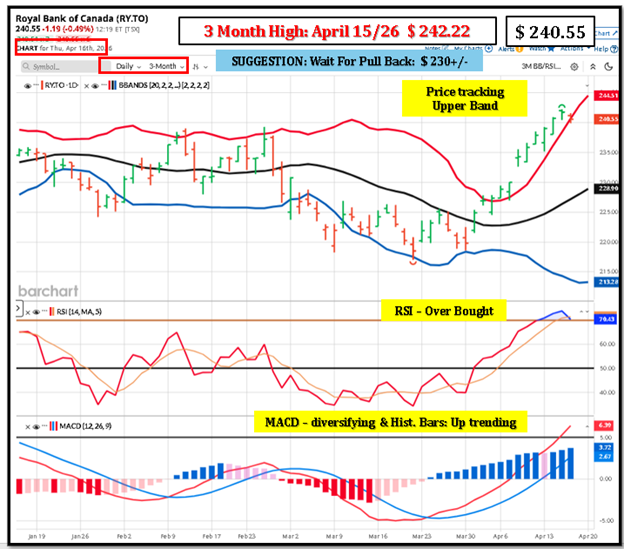
| RY.TO | Slight up / most stable | 235–255 | Highest consensus targets ($C$244–253); diversified, wealth/capital markets tailwinds support modest drift. |
| BMO.TO | Flat | 195–215 | Targets cluster $C$205–211; U.S. operations help but valuation caps upside. |
| BNS.TO | Slight up | 100–110 | Yield support + international exposure; targets $C$106–112 provide mild positive bias. |
| NA.TO | Flat to slight down | 190–205 | Strong recent performance and beats, but trading well above some historical/prior targets; mean-reversion risk higher. |
| CM.TO | Flat | 140–152 | Targets $C$144–153; solid but limited room after recent strength. |
Relative positioning: RY and BNS remain better placed for stability/modest gains. NA, CM, and BMO carry higher pullback risk if credit or macro data softens.
Key Drivers (Next 90 Days)
- Earnings cycle: Q2 reports in May/June — focus on NIM trends, loan growth, and PCLs (provisions for credit losses).
- Macro: Any acceleration in rate cuts could pressure NIM; consumer credit stress or housing softness adds downside skew.
- Capital markets/wealth: Continued strength provides support (as seen in Q1).
- Valuation: Sector already priced for good outcomes; upside requires consistent beats.
Valuation Logic Most names sit at 0–5% from 12-month targets → favors trading ranges over trends. Post-2025 rally ($strong gains) + 2026 performance leaves lower expected returns. P/E multiples above long-term averages.
Risks
- Higher credit losses (consumer, housing, commercial).
- Faster NIM compression from rate environment.
- Weaker loan growth or macro shock (trade, recession signals).
- Any U.S.-specific issues for TD/BMO.
Scenarios (Probability)
- Bull (20%): Continued earnings beats + benign rates/credit → +5–8% sector move.
- Base (60%): Inline results, stable macro → ±4–6% range-bound.
- Bear (20%): Credit deterioration or weak data → -8–12% pullback.
Actionable Takeaways Expect choppy, range-bound action rather than a clear trend. Favor RY and BNS for relative outperformance or defensiveness. NA/CM/BMO more prone to mean reversion. Next earnings cycle is the primary re-rating catalyst — watch for guidance on credit and growth. No major trend expected without a clear macro shift.
Royal Bank of Canada (RY.TO)
- Next Earnings Date: May 28, 2026 (est.)
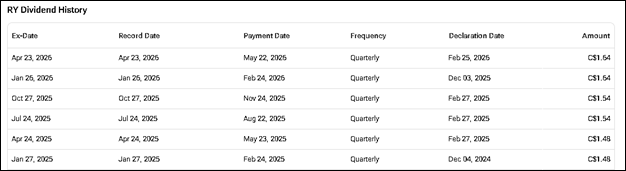
- Annual Dividend $ 6.56
RECOMMENDED FOR RRSP/TFSA based on Dividend Income.
Royal Bank of Canada operates as a diversified financial service company worldwide. The company’s Personal & Commercial Banking segment offers checking and savings accounts, home equity financing, personal lending, private banking, indirect lending, including auto financing, mutual funds and self-directed brokerage accounts, guaranteed investment certificates, credit cards, and payment products and solutions; and lending, leasing, deposit, investment, foreign exchange, cash management, auto dealer financing, trade products, and services to small and medium-sized commercial businesses. This segment offers financial products and services through branches, automated teller machines, and mobile sales network. Its Wealth Management segment provides a suite of advice-based solutions and strategies to high net worth and ultra-high net worth individuals, and institutional clients. The company’s Insurance segment offers life, health, home, auto, travel, wealth, annuities, and reinsurance advice and solutions; and business insurance services to individual, business, and group clients through its advice centers, RBC insurance stores, and mobile advisors; digital, mobile, and social platforms; independent brokers; and travel partners. Its Investor & Treasury Services segment provides asset servicing, custody, payments, and treasury services to financial and other investors; and fund and investment administration, shareholder, private capital, performance measurement and compliance monitoring, distribution, transaction banking, cash and liquidity management, foreign exchange, and global securities finance services. The company’s Capital Markets segment offers corporate and investment banking, as well as equity and debt origination, distribution, advisory services, sale, and trading services for corporations, institutional investors, asset managers, private equity firms, and governments. The company was founded in 1864 and is headquartered in Toronto, Canada.
How the Company Makes Money
RBC makes money primarily by earning net interest income and generating fee-based revenue across its major business lines. 1) Net interest income (banking spread): A core earnings driver is the spread between interest earned on loans and other interest-earning assets (e.g., personal and commercial loans, mortgages, credit cards, and certain securities) and interest paid on deposits and other funding sources. Higher loan balances, favorable deposit mix, and wider spreads generally support this income; credit losses (loan impairments) reduce profitability. 2) Fees and commissions from client services: RBC earns non-interest revenue from service charges and account fees (e.g., certain banking packages and transaction services), card-related fees, payment processing and cash management fees for businesses, and various administrative and transaction fees tied to client activity. 3) Wealth management and asset management fees: Through wealth management activities, RBC earns recurring fees based on assets under management/administration, as well as commissions and advisory fees from brokerage services, financial planning, portfolio management, and related client advice. Earnings in this area tend to be influenced by market levels (which affect client asset values) and net client flows. 4) Capital markets revenue: RBC generates revenue from underwriting and advisory services (investment banking fees), sales and trading, market making, financing, and other capital markets activities. This includes client-driven trading and related revenue, as well as gains/losses from certain market exposures; performance is influenced by market volatility, client activity, and deal volumes. 5) Insurance premiums and investment income: RBC earns money from insurance by collecting premiums (net of claims and policy benefits) and from investment income on the assets held to support insurance liabilities. Results are influenced by claims experience, policy lapses, pricing, and investment returns. 6) Investor and custody services: Through investor services activities, RBC earns fees for custody, fund services, trade settlement, and other institutional client services; revenue depends on client assets, transaction volumes, and service mandates. 7) Other income and factors: Additional earnings can come from foreign exchange and treasury activities, dividends on certain investments, and gains/losses on securities measured at fair value, depending on accounting classification. Overall profitability is also affected by operating expenses, regulatory capital and liquidity requirements, funding costs, and macroeconomic conditions (which influence loan demand and credit quality).
Company Guidance
Management’s 2026 guidance highlighted mid‑single‑digit growth in all‑bank net interest income (ex‑trading), with the bulk of the remaining $80m PPA accretion rolling off next quarter (≈ a 4‑bp headwind to Canadian banking NIM); all‑bank NIM was down 7 bps QoQ (ex‑trading NIM +1 bp QoQ) and Canadian banking NIM would have been ~+2 bps excluding the PPA effect. They reiterated low‑ to mid‑single‑digit mortgage growth and commercial loan growth nearer the lower end of mid‑ to high‑single‑digits, expect all‑bank expense growth in the mid‑single‑digit range while still delivering positive all‑bank operating leverage (1–2% for Canadian Banking), see the adjusted non‑TEB effective tax rate moving toward the higher end of the 21–23% band over the next 12 months, expect corporate support losses to trend to the lower end of $100–150m/quarter, foresee a modest ~10‑bp negative CET1 impact next quarter from retail capital parameter changes, and reiterated that full‑year 2026 provisions on impaired loans should remain within prior guidance; they also noted roughly $1bn annual technology/safety spend and continued capital returns (Q1 buybacks ≈4.2m shares / ~$1bn).
Royal Bank Of Canada (RY) Dividend Data:

NOTE:
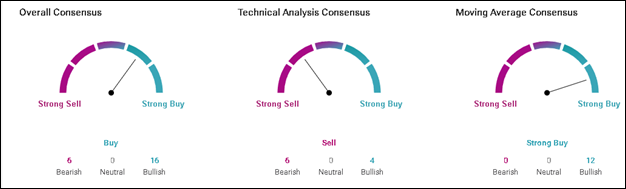
- Royal Bank Of Canada’s (RY) Moving Averages Convergence Divergence (MACD) indicator is 3.19, suggesting Royal Bank Of Canada is a Sell.
- Royal Bank Of Canada’s (RY) 20-Day exponential moving average is 230.20, while Royal Bank Of Canada’s (RY) share price is C$240.35, making it a Buy.
- Royal Bank Of Canada’s (RY) 50-Day exponential moving average is 228.14, while Royal Bank Of Canada’s (RY) share price is C$240.35, making it a Buy.
RY.TO’s 12-month analyst range is roughly C$203 to C$227, with a consensus around C$211.5 in one major source and C$206.6 in another; both imply only modest upside from recent prices.
What that means
- Base case: low-to-mid single-digit upside over 12 months.
- Bull case: toward C$227 if earnings stay strong and the market keeps paying a multiple premium.
- Bear case: low C$200s if credit costs rise or the sector de-rates.
Why the range is tight
Analysts are split between “quality compounder” and “fully valued bank” because RBC just posted strong Q1 results, but the stock already reflects much of that strength.
The main debate is whether record earnings and wealth/capital-markets strength justify further multiple expansion, or whether rising impaired loans and integration/capital considerations limit upside.
Practical takeaway
For a 12-month horizon, RY looks like a steady hold rather than a big rerating story unless the next few quarters show continued earnings beats without a credit wobble.
Key risks
Credit losses rise faster than expected. RBC’s Q1 strength came with rising impaired loans and ongoing normalization in provisions, so a weaker economy would hit earnings and the multiple.
Canadian slowdown / housing stress. RBC is heavily exposed to Canadian consumers and mortgages, so softer GDP, higher unemployment, or a housing correction would pressure loan growth and credit quality.
Multiple already rich. Analysts already describe RBC as close to fair value or fully valued, so even good earnings may not drive much upside if the market de-rates banks.
Capital markets cyclicality. RBC’s strong wealth and trading income can fade quickly if market activity cools, reducing a big support for recent earnings strength.
HSBC Canada integration / execution. The acquisition helps scale, but integration and cost synergies must keep delivering to justify the premium valuation.
What matters most
RY’s 12-month target is most vulnerable to higher credit provisions and a valuation reset, not to a collapse in earnings.
For valuation, this suggests RY.TO’s credit-loss risk is more about timing and magnitude than a permanent step-change in credit quality. If the economy stays soft, provisions can stay elevated; if conditions stabilize, they can move back down toward more normal levels.
END
Reference: March 11, 2026 Royal Bank of Canada .docx
Leave a Reply
You must be logged in to post a comment.