
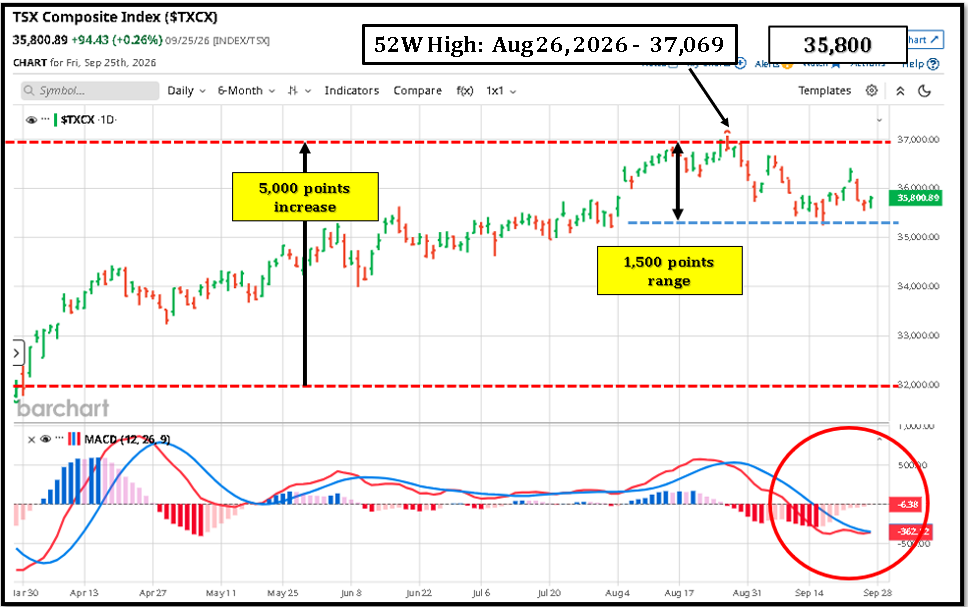
- Big picture: The TSX rose roughly 5,000 points from the ~32,000 area to approach 37,000 over the period shown.
- Current level: At 35,800.89, the index is about 1,200 points below the 37,000 resistance area.
- Recent range: Since the August peak, the TSX has largely traded in a ~35,500–37,000 range, roughly 1,500 points.
- 37,000 = resistance: The repeated failure around 37,000 suggests sellers have emerged near that level.
- 35,500 = support: The recent lows around 35,500 are an important near-term level. A sustained break below it would indicate the range is weakening.
- MACD: The MACD has turned negative, with the MACD line below the signal line and a negative histogram. This indicates weakening momentum in the near term.
- However: The index remains well above its earlier March/April levels, so the chart shows short-term consolidation/weakening momentum within a larger six-month uptrend, rather than a confirmed major reversal.
Leave a Reply
You must be logged in to post a comment.