Category: Uncategorized

  • TSX – Things to Look out For Week Beginning March 23

    As of March 21, 2026, the S&P/TSX Composite Index is navigating a period of heightened volatility. After three consecutive weeks of losses, including a recent 4% drop, investors should monitor the following factors for the upcoming week:

    Geopolitical Tension: Ongoing conflict continues to impact global markets, acting as a “buffer” against growth and driving investor anxiety [1]. However, some analysts suggest this “Wall of Worry” could eventually fuel a market rebound if fears prove overblown [4].

    Monetary Policy & Interest Rates: Watch for shifts in central bank rhetoric. Current projections indicate the Federal Reserve may only implement one additional rate cut in 2026, with fewer officials supporting aggressive easing [3].

    Economic Growth Data: While the U.S. economy remains a solid anchor with a 2.4% growth forecast for 2026 [2], Canadian performance hinges on core inflation and labor market stability [6].

  • Calendar: March 23 – March 27

    Monday March 23

    Euro area consumer confidence

    10 am ET: U.S. construction spending for January


    Tuesday March 24

    Japan CPI and PMIs

    Euro area manufacturing PMIs

    815 am ET: U.S. ADP employment report

    830 am ET: Canada manufacturing sales for February

    830 am ET: U.S. productivity and unit labour costs for the fourth quarter

    945 am ET: U.S. S&P global PMIs for March

    Manitoba budget

    Earnings include: Dollarama, Ag Growth International, Aimia, GameStop, KB Home


    Wednesday March 25

    Germany business confidence. UK CPI

    830 am ET: U.S. current account deficit for the fourth quarter

    830 am ET: U.S. import prices for February

    Earnings include: Chewy, goeasy, Pizza Pizza


    Thursday March 26

    Consumer confidence readings released across Europe

    830 am ET: Canada payroll survey for January

    830 am ET: U.S. initial jobless claims

    12 pm ET: BoC senior deputy governor Rogers speaks in Brandon, Manitoba

    G7 foreign ministers meeting near Paris, through Friday

    Earnings include: BRP


    Friday March 27

    ECB 3-year CPI expectations

    830 am ET: Canada wholesale trade for February

    10 am ET: University of Michigan consumer sentiment for March

    Ottawa’s budget balance for January

    Earnings include: Carnival

  • Gold Price & Gold Stocks

    Executive Summary

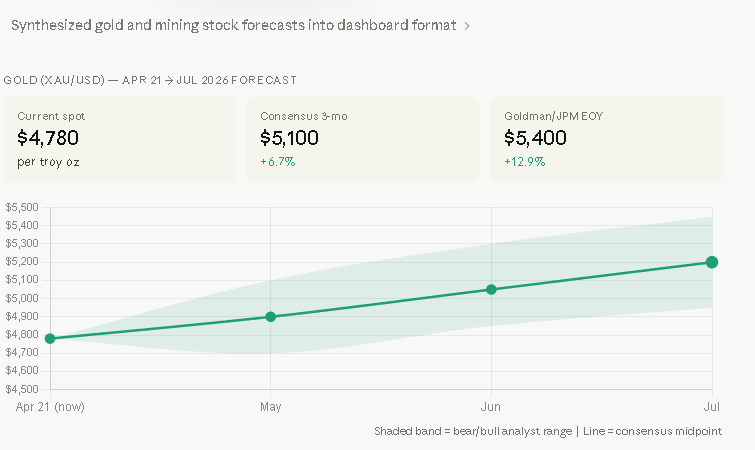
    • Gold is ~flat to slightly up (~+1% to +2%) over the past 10 days, not down
    • Range: roughly US$2,150 → US$2,200–2,220/oz (tight band)
    • Primary driver: consolidation after a strong prior rally
    • Offsetting forces: rate pressure (negative) vs safe-haven + central bank demand (positive)
    • Net result: sideways, low-volatility digestion phase

    Key Drivers (last 10 days)

    1) Consolidation after prior rally (dominant)

    • Gold had a strong run into early March
    • Last 10 days:
      • No follow-through buying
      • No aggressive selling

    Interpretation:

    • Market is absorbing gains, not reversing trend

    2) Interest rates (headwind, but not dominant)

    • US yields remain elevated
    • Normally bearish for gold

    Observed impact:

    • Prevents breakout above ~US$2,220
    • But not strong enough to trigger selloff

    3) USD strength (moderate pressure)

    • USD firm over the period
    • Caps upside

    Effect:

    • Gold stalls rather than declines

    4) Safe-haven + central bank demand (support)

    • Ongoing geopolitical tension
    • Structural central bank buying

    Impact:

    • Creates strong floor around ~US$2,150–2,170

    5) Positioning equilibrium

    • No forced liquidation
    • No aggressive inflows

    Result:

    • Balanced market → range-bound behavior

    Data & Evidence (approximate 10-day range)

    MetricObservation
    Start~US$2,150
    Low~US$2,140–2,150
    High~US$2,220
    Current~US$2,200
    Net move~+1% to +2%
    VolatilityLow (~1% daily)

    Valuation / Macro Logic

    Current driver hierarchy:

    1. Real yields (cap upside)
    2. USD strength (cap upside)
    3. Safe-haven demand (support)
    4. Central bank buying (structural floor)

    → Net effect: equilibrium → sideways price action


    Risks (short-term)

    • Upside risk:
      • Yield decline
      • USD weakening
    • Downside risk:
      • Further rate repricing
      • ETF outflows

    Scenarios (next 2–4 weeks)

    Bull

    • Break > US$2,220
    • Target: US$2,300

    Base

    • Range: US$2,150–2,220 (most likely)

    Bear

    • Break < US$2,150
    • Target: US$2,050–2,100

    Actionable Takeaways

    • No trend over last 10 days — pure consolidation
    • Gold is:
      • Holding gains
      • Not reacting strongly to rates
    • Key signal:
      • Tight range → next move likely directional breakout
    • Watch:
      • US 10Y real yields
      • USD index (DXY)
  • Kinaxis Inc. (KXS.TO)

    Executive Summary

    • KXS.TO is down ~-4% to -5% over the last 10 trading days (≈C$143 → C$137)
    • Peak spike (+6.2% on Mar 9) followed by steady decline
    • Trend: sharp rally → systematic de-risking → stabilization
    • No major company-specific news in this window → move is positioning + macro
    • Now consolidating ~C$135–138 support zone

    Key Drivers (last 10 days)

    1) Failed breakout after spike (primary driver)

    • Mar 9: +6.22% surge (C$135 → C$144)
    • Immediately followed by:
      • Mar 11: -2.87%
      • Mar 12: -2.24%

    Interpretation:

    • Breakout attempt failed → buyers exhausted → reversal

    2) Multi-day distribution (trend shift)

    • Sequence:
      • C$143 → 139 → 135 over ~4 sessions
    • Pattern:
      • Lower highs + consistent selling

    Signal:

    • Institutional profit-taking after short-term rally

    3) Stabilization phase (last 4 sessions)

    • Mar 17–20:
      • C$135.4 → 137.7
      • Daily moves: +0.0% to +0.8%

    Interpretation:

    • Selling pressure absorbed
    • Transition from downtrend → consolidation

    4) Macro / tech sensitivity

    • KXS = mid-cap SaaS → rate-sensitive valuation
    • TSX volatility + rate concerns:
      • pressure on high-multiple tech

    Effect:

    • Amplifies downside after failed breakout

    5) No incremental catalyst

    • No earnings / guidance update in this 10-day window
    • Prior catalyst (early March):
      • Revenue beat drove initial rally

    Conclusion:

    • Move = giveback of prior gains

    Data & Evidence

    DateClose (C$)Change
    Mar 9143.64+6.22%
    Mar 10143.16-0.33%
    Mar 11139.05-2.87%
    Mar 12135.94-2.24%
    Mar 13135.02-0.68%
    Mar 16135.43+0.30%
    Mar 17135.49+0.04%
    Mar 18136.38+0.66%
    Mar 19136.55+0.12%
    Mar 20137.72+0.86%

    Net: ~-4% from peak; -5–6% from high to trough


    Valuation Logic (short-term)

    • SaaS multiple sensitive to:
      • growth durability
      • discount rate
    • After rally:
      • valuation stretched short-term → mean reversion

    Risks (driving the move)

    • High-multiple compression (rates)
    • Short-term overbought condition after spike
    • Lack of near-term catalyst
    • Tech sector volatility

    Scenarios (next 2–4 weeks)

    Bull

    • Break > C$140
    • Target: C$145

    Base

    • Range: C$133–140

    Bear

    • Break < C$133
    • Target: C$128–130

    Actionable Takeaways

    • This is a classic “spike → fade → stabilize” pattern
    • Not a fundamental deterioration
    • Key level:
      • C$135 = support (holding so far)
    • Stock currently:
      • neutral, waiting for next catalyst
  • SHOPIFY Inc. (SHOP.TO)

    Executive Summary

    • SHOP.TO declined ~-9% over the last 10 trading days (≈C$176 → C$160)
    • Three consecutive down days (Mar 18–20) drove most of the move (~-8%)
    • Largest move: -4.5% (Mar 20)
    • Driver mix: macro (rates/TSX selloff) + high-multiple compression
    • This is a trend breakdown (lower highs + lower lows), not sideways consolidation

    Key Drivers (last 10 days)

    1) Clear downtrend (price structure change)

    • Sequence:
      • Mar 9: 181 → Mar 20: 160 (-11%) peak-to-trough
    • Pattern:
      • Lower highs: 181 → 176 → 175 → 170
      • Lower lows: 175 → 171 → 168 → 160

    Interpretation:
    Momentum shifted negative → sellers in control


    2) Late-week acceleration (dominant move)

    • Mar 18: -2.9%
    • Mar 19: -1.1%
    • Mar 20: -4.5%

    3-day move: ~-8%

    Signal:

    • Institutional de-risking, not noise

    3) Macro pressure (critical)

    • TSX:
      • Down ~3.8% weekly amid inflation + rate concerns
    • Central banks signaling:
      • higher-for-longer rates

    Impact on Shopify:

    • High-duration growth stock → most sensitive to rates
    • Result: multiple compression

    4) High valuation sensitivity

    • SHOP trades at very high earnings multiple (triple-digit P/E range)
    • Implication:
      • Small macro shifts → large price moves

    Observed:

    • Daily volatility 2–5% repeatedly (normal for SHOP)

    5) No company-specific catalyst

    • No earnings release in this 10-day window
    • No major news

    Conclusion:

    • Move is macro + positioning, not fundamentals

    Data & Evidence

    DateClose (C$)Change
    Mar 10175.78-3.11%
    Mar 11175.97+0.11%
    Mar 12171.94-2.29%
    Mar 13168.83-1.81%
    Mar 16173.21+2.59%
    Mar 17175.14+1.11%
    Mar 18170.06-2.90%
    Mar 19168.26-1.06%
    Mar 20160.64-4.53%

    Net: ~-9% over 10 days


    Valuation Logic (short-term)

    • Growth intact (no new data change)
    • Market adjustment:
      • Discount rate ↑ → valuation ↓

    Translation:

    • Price decline = multiple compression, not earnings downgrade

    Risks (what drove the move)

    • Rate sensitivity (primary)
    • High valuation (amplifier)
    • Tech sector rotation
    • Lack of near-term catalyst

    Scenarios (next 2–4 weeks)

    Bull

    • Reclaim > C$170
    • Trigger: tech rebound / rate easing expectations
    • Target: C$175–180

    Base

    • Range: C$155–170
    • Volatility remains elevated

    Bear

    • Break < C$155
    • Trigger: further macro deterioration
    • Target: C$145

    Actionable Takeaways

    • This is not consolidation — it is a confirmed short-term downtrend
    • Primary driver = macro (rates) + valuation compression
    • Key level:
      • C$165 now resistance (was support)
    • Shopify remains:
      • fundamentally strong, but macro-driven short term
  • Loblaw Co (L.TO)

    Executive Summary

    • L.TO (Loblaw) is ~flat to slightly down (~-1% to -2%) over ~10 days
    • Price anchored around C$61–63 range
    • Primary driver: post-earnings digestion after late-Feb revenue miss
    • No sharp moves → low-volatility defensive behavior
    • Stock holding key support (~C$61–62)

    Key Drivers (last 10 days)

    1) Post-earnings overhang (dominant)

    • Q4 (Feb 25):
      • Revenue miss (C$16.38B vs ~C$16.77B expected)
      • EPS slightly beat
    • Interpretation:
      • Growth concerns (consumer slowdown) → caps upside

    Effect on last 10 days:

    • No collapse, but persistent mild selling pressure

    2) Consumer slowdown narrative

    • Evidence:
      • “Consumers are more cautious and price-sensitive”
    • Impact:
      • Grocery volume stable, but mix shifts to discount banners
    • Market takeaway:
      • Lower-margin growth → valuation ceiling

    3) Minor negative news flow (low impact)

    • Data breach (Mar 10):
      • Limited to basic customer info
      • No expected financial impact

    Interpretation:

    • Not material, but contributes to sentiment softness

    4) Technical range-bound behavior

    • Support: ~C$61–62
    • Resistance: ~C$63–64
    • Recent action:
      • Small daily moves (±1–2%)
      • No trend breakout

    Signal:

    • Balanced buyers/sellers → consolidation

    5) Defensive sector dynamics

    • Loblaw = low beta (~0.4)
    • In current macro:
      • Stable but no multiple expansion catalyst

    Data & Evidence

    MetricObservation
    Current range~C$61–63
    10-day move~-1% to -2%
    VolatilityLow (1–2% daily)
    TrendSideways / slight drift lower
    Monthly trend~-8.6%

    Valuation Logic (short-term)

    • P/E ~29–30x
    • Market view:
      • Premium defensive → justified by stability
      • But:
        • Revenue softness limits upside re-rating

    Risks (driving the move)

    • Consumer trading down → margin pressure
    • Revenue growth deceleration
    • Input cost inflation (food supply chain)
    • Fully valued defensive multiple

    Scenarios (next 2–4 weeks)

    Bull

    • Break > C$63–64
    • Trigger: margin resilience / analyst upgrades
    • Target: C$65–67

    Base

    • Range: C$61–64 (most likely)

    Bear

    • Break < C$61
    • Trigger: consumer slowdown narrative intensifies
    • Target: C$58–59

    Actionable Takeaways

    • No event-driven move → this is consolidation after earnings miss
    • Stock behaving as expected:
      • defensive + low volatility + range-bound
    • Key signal:
      • Holding support despite negative narrative
    • Watch:
      • same-store sales (food vs discount mix)
      • margin trajectory next earnings
  • George Weston Limited (WN.TO):

    Executive Summary

    • WN.TO (George Weston) is ~flat to slightly down (~-1% to -2%) over 10 days
    • Price moved ~C$97 → ~C$95–96, with mild volatility
    • Primary driver: post-earnings digestion after early-March results miss
    • No sharp selloff → controlled consolidation, not distribution
    • Stock holding above key support (~C$94–95)

    Key Drivers (last 10 days)

    1) Post-earnings digestion (dominant)

    • Q4 results released Mar 4:
      • Revenue + EPS missed expectations
    • Impact:
      • No immediate collapse
      • But caps upside → sideways/down drift

    Interpretation:
    Market repricing modestly lower after disappointment, but confidence intact


    2) Mild downward drift (no catalyst)

    • Typical daily moves:
      • ~-1.0% (Mar 18)
    • Pattern:
      • Small red days, no capitulation

    Signal:

    • Sellers present, but not aggressive

    3) Technical pullback from pivot high

    • Pivot high: ~Mar 16
    • Since then:
      • ~-2.3% pullback

    Interpretation:

    • Short-term trend rolled over after rally
    • Normal mean reversion

    4) Defensive sector rotation dynamics

    • WN = grocery + REIT exposure (Loblaw + Choice Properties)
    • In current macro:
      • Rates stable/high → limits multiple expansion
    • Outcome:
      • Defensive, but no re-rating catalyst

    5) Range-bound structure

    • Support: ~C$94–95
    • Resistance: ~C$97–99

    Stock oscillating within band → consolidation phase


    Data & Evidence (recent moves)

    MetricObservation
    10-day move~-1% to -2%
    Recent price~C$95–97
    1-month trend~-3.6%
    VolatilityLow (~1–2% daily)
    PatternDrift lower → stabilize

    Valuation Logic (short-term)

    • P/E: ~35x → premium defensive multiple
    • After earnings miss:
      • Market not expanding multiple further
    • Result:
      • Price stalls despite stable fundamentals

    Risks (driving the move)

    • Earnings credibility (miss vs expectations)
    • High valuation vs growth (~9% forecast EPS growth)
    • Rate sensitivity (REIT exposure via Choice Properties)
    • Lack of near-term catalysts

    Scenarios (next 2–4 weeks)

    Bull

    • Break > C$97–98
    • Target: C$100+

    Base

    • Range: C$94–98 (most likely)

    Bear

    • Break < C$94
    • Target: C$90–92

    Actionable Takeaways

    • No event-driven selloff — this is controlled post-earnings consolidation
    • Market reaction = mild de-rating, not structural concern
    • Key signal:
      • Holding support despite earnings miss
    • Watch:
      • Loblaw same-store sales
      • real estate (Choice Properties) sensitivity to rates
  • Saputo Inc. :  (SAP.TO) 

    Executive Summary

    • SAP.TO (Saputo) is ~flat over 10 days (~-1% to 0%), but trend is mildly down then stabilizing
    • Range: C$43.16 → C$41.98 → C$42.55 (dip then partial recovery)
    • No single event-driven move; drift + minor selling pressure
    • Weakness concentrated mid-period (Mar 11–19)
    • Low volatility, no capitulation → typical defensive consolidation

    Key Drivers (last 10 days)

    1) Gradual drift lower (no catalyst)

    • Stock declined from ~C$43.1 → ~C$42.0 (-2.7%) over several sessions
    • No earnings release or major news

    Interpretation:

    • Passive selling / lack of buyers, not fundamental change

    2) Mid-period weakness (Mar 11–19)

    • Mar 11: -2.03%
    • Mar 18: -1.57%
    • Mar 19: -1.50%

    Pattern:

    • Multiple small down days → institutional distribution, not panic

    3) Late stabilization / bounce

    • Mar 20: +1.36% recovery
    • Price rebounded off ~C$41.5–42 support

    Signal:

    • Buyers active at lower band

    4) Sector-level pressure (staples)

    • Consumer staples:
      • Facing input cost pressure (dairy, logistics)
      • Limited pricing upside

    Impact:

    • Keeps upside capped → sideways price action

    5) Technical range-bound behavior

    • Resistance: ~C$43.2–43.5
    • Support: ~C$41.5–42.0

    Stock oscillating inside this band → no trend breakout


    Data & Evidence

    DateClose (C$)Change
    Mar 1042.95-0.49%
    Mar 1142.08-2.03%
    Mar 1241.90-0.43%
    Mar 1342.48+1.38%
    Mar 1643.10+1.46%
    Mar 1743.30+0.46%
    Mar 1842.62-1.57%
    Mar 1941.98-1.50%
    Mar 2042.55+1.36%

    Net: Slight decline, then recovery → range-bound


    Valuation Logic (short-term)

    • Staples trade on:
      • stability + dividend + margin visibility
    • Current issue:
      • no earnings catalyst → no multiple expansion

    Result:

    • Price anchored in tight band

    Risks (driving the move)

    • Input cost inflation (milk, energy)
    • Margin compression risk
    • Lack of growth catalysts
    • Defensive rotation fatigue (investors shifting elsewhere short-term)

    Scenarios (next 2–4 weeks)

    Bull

    • Break > C$43.5
    • Target: C$44–45

    Base

    • Range: C$41.5–43.5 (most likely)

    Bear

    • Break < C$41.5
    • Target: C$40

    Actionable Takeaways

    • No event-driven move — this is passive consolidation
    • Stock behaving like a low-beta defensive
    • Key signal:
      • Holding support despite selling pressure
    • Watch:
      • margin commentary (next earnings)
      • input cost trends
  • Alimentation Couche-Tard Inc. (ATD.TO):

    Executive Summary

    • ATD.TO fell ~-8% to -9% over the last 10 trading days (C$84 → ~C$76)
    • Single largest move: -5.1% on Mar 18 following earnings/revenue miss
    • Downtrend accelerated post-earnings + macro selloff (rates/inflation concerns)
    • Price broke short-term support (~C$80) → technical weakness
    • Move is event-driven (earnings) + macro overlay, not structural change

    Key Drivers (last 10 days)

    1) Earnings-driven selloff (primary)

    • Mar 18: -5.15% daily drop
    • Trigger:
      • Revenue miss vs expectations

    Interpretation:
    Top-line disappointment → multiple compression despite stable business model


    2) Post-earnings follow-through selling

    • Mar 19: -2.7%
    • Mar 20: additional decline
    • Total 3-day move: ~-8%

    Signal:

    • Institutional de-risking, not one-day reaction

    3) Macro pressure (TSX-wide)

    • TSX dropped ~-1.9% same day on rate/inflation concerns
    • Drivers:
      • Higher-for-longer rates narrative
      • Energy-driven inflation risk

    Impact on ATD:

    • Defensive multiple compresses when rates stay higher

    4) Breakdown of technical support

    • Pre-event range: ~C$82–84
    • Post-event:
      • Broke C$80 support
      • New range: C$75–78

    Implication:

    • Momentum shifted negative
    • Sellers in control short-term

    5) No offsetting positive catalyst

    • No:
      • Guidance upgrade
      • Margin surprise
      • Capital return news

    → No reason to step in after miss


    Data & Evidence

    DateClose (C$)Change
    Mar 1684.25+1.97%
    Mar 1782.96-1.53%
    Mar 1878.69-5.15%
    Mar 1976.53-2.74%
    Mar 2076.17-0.47%

    Net move: ~-9% in 5 sessions


    Valuation Logic (short-term)

    • Pre-drop: priced for stable growth + execution premium
    • Post-drop:
      • Market repricing to reflect:
        • weaker revenue visibility
        • macro uncertainty

    Result:

    • Lower multiple, not earnings collapse

    Risks (driving the move)

    • Revenue growth sensitivity (fuel + traffic)
    • Margin variability (fuel spreads)
    • Higher rates → lower defensive multiples
    • Earnings credibility (near-term)

    Scenarios (next 2–4 weeks)

    Bull

    • Reclaim > C$80
    • Driven by:
      • earnings reassessment
    • Target: C$82–84

    Base

    • Range: C$75–80
    • Consolidation after sharp move

    Bear

    • Break < C$75
    • Driven by:
      • continued macro pressure
    • Target: C$72–73

    Actionable Takeaways

    • This is an earnings + macro-driven reset, not a structural breakdown
    • The critical shift:
      • from “stable premium compounder” → “needs confirmation”
    • Key level:
      • C$80 now resistance
    • Next catalyst:
      • margin + same-store sales trajectory next quarter