
Executive Summary
- SHOP.TO declined ~-9% over the last 10 trading days (≈C$176 → C$160)
- Three consecutive down days (Mar 18–20) drove most of the move (~-8%)
- Largest move: -4.5% (Mar 20)
- Driver mix: macro (rates/TSX selloff) + high-multiple compression
- This is a trend breakdown (lower highs + lower lows), not sideways consolidation
Key Drivers (last 10 days)
1) Clear downtrend (price structure change)
- Sequence:
- Mar 9: 181 → Mar 20: 160 (-11%) peak-to-trough
- Pattern:
- Lower highs: 181 → 176 → 175 → 170
- Lower lows: 175 → 171 → 168 → 160
Interpretation:
Momentum shifted negative → sellers in control
2) Late-week acceleration (dominant move)
- Mar 18: -2.9%
- Mar 19: -1.1%
- Mar 20: -4.5%
3-day move: ~-8%
Signal:
- Institutional de-risking, not noise
3) Macro pressure (critical)
- TSX:
- Down ~3.8% weekly amid inflation + rate concerns
- Central banks signaling:
- higher-for-longer rates
Impact on Shopify:
- High-duration growth stock → most sensitive to rates
- Result: multiple compression
4) High valuation sensitivity
- SHOP trades at very high earnings multiple (triple-digit P/E range)
- Implication:
- Small macro shifts → large price moves
Observed:
- Daily volatility 2–5% repeatedly (normal for SHOP)
5) No company-specific catalyst
- No earnings release in this 10-day window
- No major news
Conclusion:
- Move is macro + positioning, not fundamentals
Data & Evidence
| Date | Close (C$) | Change |
|---|---|---|
| Mar 10 | 175.78 | -3.11% |
| Mar 11 | 175.97 | +0.11% |
| Mar 12 | 171.94 | -2.29% |
| Mar 13 | 168.83 | -1.81% |
| Mar 16 | 173.21 | +2.59% |
| Mar 17 | 175.14 | +1.11% |
| Mar 18 | 170.06 | -2.90% |
| Mar 19 | 168.26 | -1.06% |
| Mar 20 | 160.64 | -4.53% |
Net: ~-9% over 10 days
Valuation Logic (short-term)
- Growth intact (no new data change)
- Market adjustment:
- Discount rate ↑ → valuation ↓
Translation:
- Price decline = multiple compression, not earnings downgrade
Risks (what drove the move)
- Rate sensitivity (primary)
- High valuation (amplifier)
- Tech sector rotation
- Lack of near-term catalyst
Scenarios (next 2–4 weeks)
Bull
- Reclaim > C$170
- Trigger: tech rebound / rate easing expectations
- Target: C$175–180
Base
- Range: C$155–170
- Volatility remains elevated
Bear
- Break < C$155
- Trigger: further macro deterioration
- Target: C$145
Actionable Takeaways
- This is not consolidation — it is a confirmed short-term downtrend
- Primary driver = macro (rates) + valuation compression
- Key level:
- C$165 now resistance (was support)
- Shopify remains:
- fundamentally strong, but macro-driven short term
If you want, I can quantify how a +50 bps rate shift impacts SHOP’s implied valuation vs TSX peers (KXS, CSU)—that explains most of this move quantitatively.
KXS.TO explain share price over past 10 days, without fluff
Executive Summary
- KXS.TO is down ~-4% to -5% over the last 10 trading days (≈C$143 → C$137)
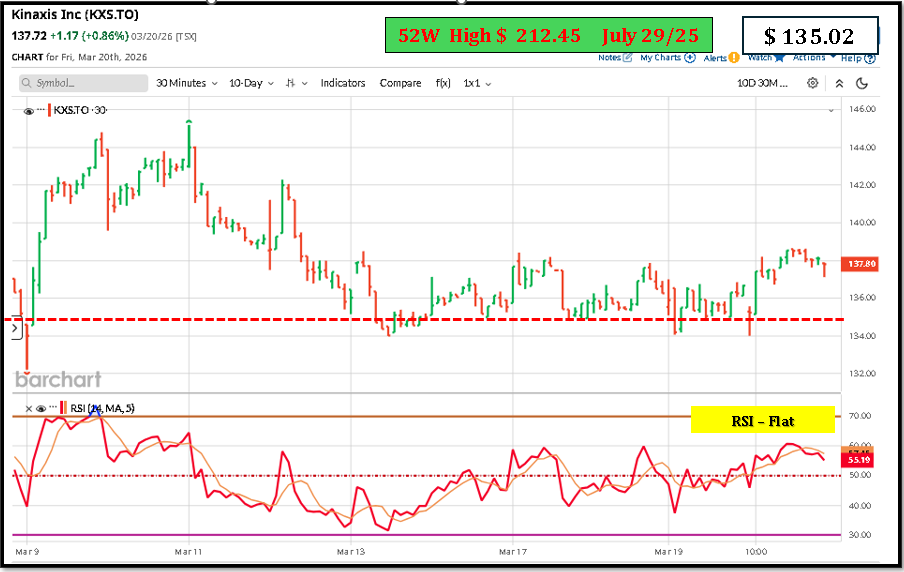
- Peak spike (+6.2% on Mar 9) followed by steady decline
- Trend: sharp rally → systematic de-risking → stabilization
- No major company-specific news in this window → move is positioning + macro
- Now consolidating ~C$135–138 support zone
Key Drivers (last 10 days)
1) Failed breakout after spike (primary driver)
- Mar 9: +6.22% surge (C$135 → C$144)
- Immediately followed by:
- Mar 11: -2.87%
- Mar 12: -2.24%
Interpretation:
- Breakout attempt failed → buyers exhausted → reversal
2) Multi-day distribution (trend shift)
- Sequence:
- C$143 → 139 → 135 over ~4 sessions
- Pattern:
- Lower highs + consistent selling
Signal:
- Institutional profit-taking after short-term rally
3) Stabilization phase (last 4 sessions)
- Mar 17–20:
- C$135.4 → 137.7
- Daily moves: +0.0% to +0.8%
Interpretation:
- Selling pressure absorbed
- Transition from downtrend → consolidation
4) Macro / tech sensitivity
- KXS = mid-cap SaaS → rate-sensitive valuation
- TSX volatility + rate concerns:
- pressure on high-multiple tech
Effect:
- Amplifies downside after failed breakout
5) No incremental catalyst
- No earnings / guidance update in this 10-day window
- Prior catalyst (early March):
- Revenue beat drove initial rally
Conclusion:
- Move = giveback of prior gains
Data & Evidence
| Date | Close (C$) | Change |
|---|---|---|
| Mar 9 | 143.64 | +6.22% |
| Mar 10 | 143.16 | -0.33% |
| Mar 11 | 139.05 | -2.87% |
| Mar 12 | 135.94 | -2.24% |
| Mar 13 | 135.02 | -0.68% |
| Mar 16 | 135.43 | +0.30% |
| Mar 17 | 135.49 | +0.04% |
| Mar 18 | 136.38 | +0.66% |
| Mar 19 | 136.55 | +0.12% |
| Mar 20 | 137.72 | +0.86% |
Net: ~-4% from peak; -5–6% from high to trough
Valuation Logic (short-term)
- SaaS multiple sensitive to:
- growth durability
- discount rate
- After rally:
- valuation stretched short-term → mean reversion
Risks (driving the move)
- High-multiple compression (rates)
- Short-term overbought condition after spike
- Lack of near-term catalyst
- Tech sector volatility
Scenarios (next 2–4 weeks)
Bull
- Break > C$140
- Target: C$145
Base
- Range: C$133–140
Bear
- Break < C$133
- Target: C$128–130
Actionable Takeaways
- This is a classic “spike → fade → stabilize” pattern
- Not a fundamental deterioration
- Key level:
- C$135 = support (holding so far)
- Stock currently:
- neutral, waiting for next catalyst
Leave a Reply
You must be logged in to post a comment.