Executive Summary
- Alimentation Couche‑Tard (TSX: ATD) declined modestly over the last ~10 trading days primarily due to profit-taking after hitting a 52-week high and consolidation ahead of earnings.
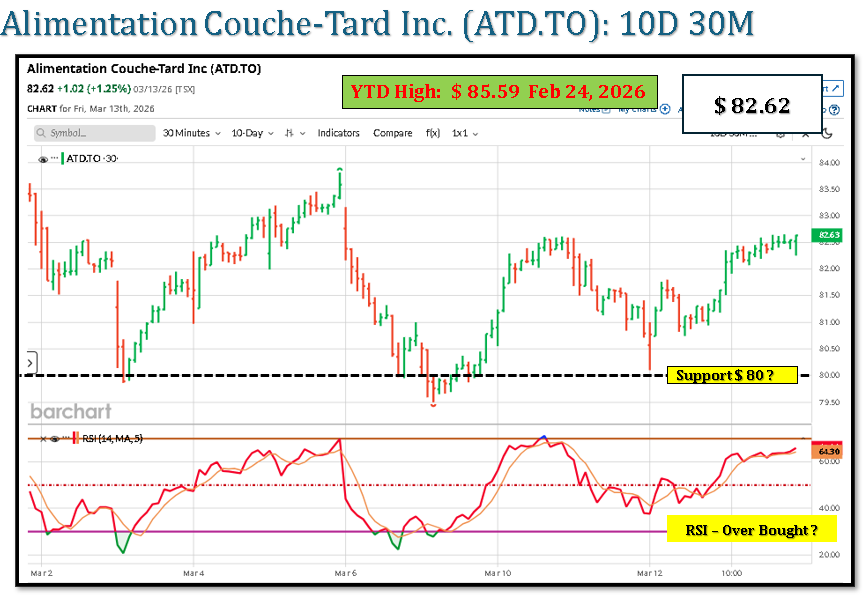
- The stock recently traded around C$82–84 after peaking near ~C$85, remaining within its annual range of C$65.95–C$85.59.
- No material fundamental deterioration occurred; the move appears technical and valuation-driven.
- Key technical levels: support C$80–82, resistance C$85–87.
- Analyst consensus implies moderate upside with a 12-month target ~C$89–91 and high estimates around C$100.
1. Drivers of the Share Price Decline (Past ~10 Days)
1. Profit-Taking After 52-Week High
ATD recently reached the upper end of its 52-week range (~C$85).
When a stock approaches a multi-year high:
- short-term investors often lock in gains
- momentum traders reduce exposure
This results in a pullback without any fundamental catalyst.
2. Limited Near-Term Valuation Upside
Analyst targets cluster close to the current price.
| Metric | Value |
|---|---|
| Current price range | ~C$82–84 |
| Avg. 12-month target | ~C$89–91 |
| High estimate | ~C$100 |
| Low estimate | ~C$81–82 |
Sources: analyst consensus.
Implication:
- The stock already trades close to fair value
- Near-term upside appears single-digit %
This reduces buying pressure.
3. Positioning Ahead of Earnings
The next earnings release is expected March 17, 2026.
Institutional behavior ahead of earnings typically includes:
- trimming exposure
- reducing risk around results
This can cause short-term price drift lower.
4. Broader Market Rotation
In recent weeks the TSX has seen:
- capital rotating between defensives and cyclicals
- consumer names consolidating after strong runs
ATD remains up ~11% YTD, which also increases the probability of short-term consolidation.
2. Technical Structure
Support and Resistance
| Level | Price (CAD) | Interpretation |
|---|---|---|
| Major resistance | 85–87 | Recent highs / 52-week high zone |
| Near resistance | 84–85 | Supply zone from recent rally |
| Pivot / fair value | 82–83 | Current consolidation range |
| Near support | 80–82 | Strong buying zone |
| Major support | 76–78 | 100-day trend support |
Technical signals remain neutral-to-bullish because the stock trades above major moving averages.
3. Macro and Sector Drivers
ATD is sensitive to:
| Driver | Impact on Earnings |
|---|---|
| Fuel volumes | Core traffic driver |
| Fuel margins | Short-term profit volatility |
| Food & convenience sales | Higher margin growth |
| M&A activity | Long-term expansion |
Recent earnings showed growing same-store sales and strong margins, indicating fundamentals remain stable.
4. Scenario Outlook
3-Month Outlook
| Scenario | Price Range | Drivers |
|---|---|---|
| Bear | 78–80 | weaker fuel demand or weak earnings |
| Base | 80–87 | consolidation near fair value |
| Bull | 87–92 | strong earnings or margin expansion |
Most probable: range-bound consolidation.
12-Month Outlook (Analyst Consensus)
| Scenario | Price Range | Drivers |
|---|---|---|
| Bear | 75–80 | margin compression or weak consumer spending |
| Base | 88–95 | steady earnings growth |
| Bull | 95–100+ | acquisitions or strong global expansion |
Consensus implies ~8–10% upside from current levels.
5. Key Risks
Operational
- declining fuel volumes
- lower fuel margins
- consumer spending slowdown
Strategic
- acquisition execution risk
- integration challenges
Market
- valuation compression if retail sector multiples fall
6. What Would Change the Outlook
Bullish revision triggers:
- stronger convenience-store margins
- successful acquisitions
- accelerated food-service growth
Bearish triggers:
- fuel demand decline
- weak consumer spending
- earnings miss.
✅ Bottom line:
The recent ~10-day decline in ATD is primarily technical consolidation after a rally and positioning ahead of earnings, not a deterioration in fundamentals. Current market data supports a near-term trading range of roughly C$80–87, with 12-month consensus targets near C$89–95.
Leave a Reply
You must be logged in to post a comment.