
Summary
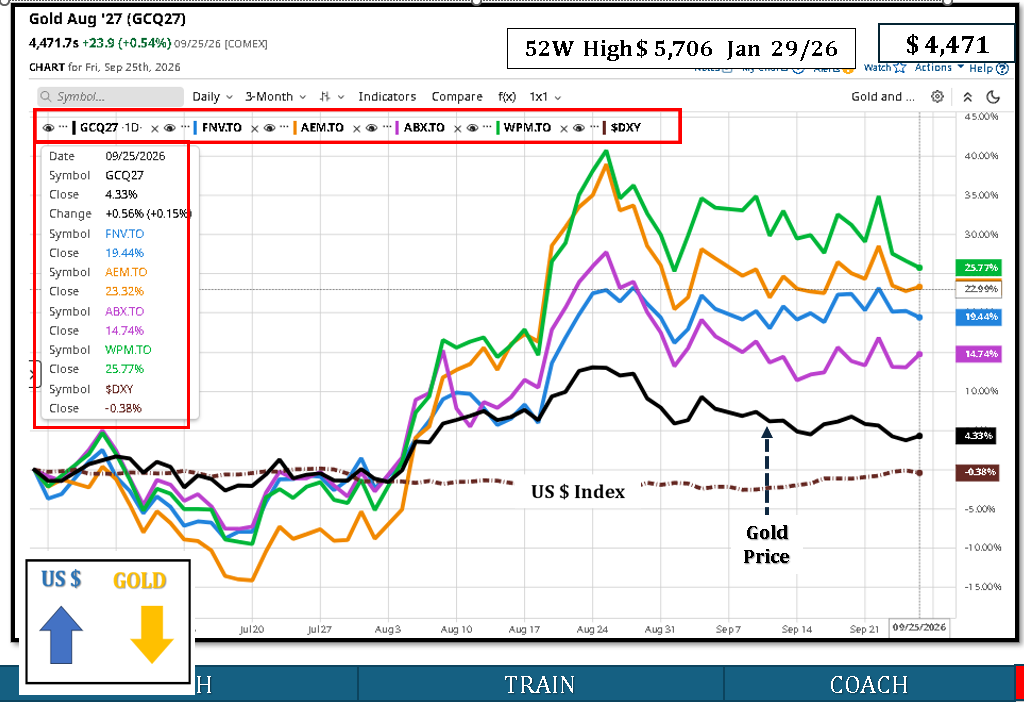
- The chart shows gold futures up about 4.3% over three months, despite a recent pullback.
- Gold’s main supports have been geopolitical risk, safe-haven demand and longer-term institutional/central-bank demand.
- More recently, higher U.S. interest rates, rising Treasury yields and a stronger U.S. dollar have restrained gold. Reuters
- All four Canadian-listed precious-metals names shown significantly outperformed gold over the period.
- Performance shown on the chart: WPM +25.77%, AEM +23.32%, FNV +19.44%, ABX +14.74%.
3-Month Performance
| Asset | Approx. 3-Month Change | Relative to Gold |
|---|---|---|
| WPM.TO | +25.77% | Strong outperformer |
| AEM.TO | +23.32% | Strong outperformer |
| FNV.TO | +19.44% | Outperformer |
| ABX.TO | +14.74% | Outperformer |
| Gold futures | +4.33% | Benchmark |
| U.S. Dollar Index | −0.38% | Slightly lower over period |
Why Gold Rose
The biggest upward move occurred during August, when gold accelerated sharply.
1. Geopolitical uncertainty
Middle East tensions, including conflict involving Iran and risks around the Strait of Hormuz, supported demand for gold as a defensive asset. Gold reached a three-month high in late August amid continued Middle East conflict and political uncertainty.
2. Safe-haven demand
Gold typically benefits when investors become more concerned about geopolitical, financial or economic risk. That was an important driver of the August advance.
3. Longer-term investment demand
Institutional flows, central-bank buying and demand for alternatives to traditional financial assets have provided structural support to gold during 2026. Reuters
Why Gold Has Recently Pulled Back
The picture changed in September.
The Federal Reserve raised rates and markets began pricing further tightening. Higher interest rates increase the opportunity cost of owning gold because gold produces no interest income.
U.S. Treasury yields also rose sharply, while the dollar strengthened. Both tend to pressure gold. On September 25, gold rebounded modestly as the dollar eased, but still finished the week roughly 2% lower because of higher yields and additional Fed rate-hike expectations.
So the current gold environment is a tug-of-war:
Geopolitical risk / safe-haven demand ↑ gold
versus
Higher rates / higher bond yields / stronger USD ↓ gold
Gold Stocks
Gold stocks often move more than gold itself because changes in the gold price can have a leveraged effect on miners’ cash flows.
WPM.TO — Wheaton Precious Metals
3-month gain: +25.77%
WPM is the strongest performer shown.
Wheaton is primarily a precious-metals streaming company, rather than a conventional miner. It finances mines in exchange for the right to buy a portion of future metal production at predetermined prices.
That structure gives it substantial exposure to rising gold prices while generally reducing direct exposure to mine-level operating costs.
Chart interpretation: WPM surged more than 40% at its August peak, before consolidating to approximately +25.8%.
AEM.TO — Agnico Eagle
3-month gain: +23.32%
Agnico Eagle closely tracked the gold rally but amplified it substantially.
A miner’s revenue rises when gold prices increase while many operating costs do not rise equally fast. This creates operating leverage.
Simple example:
If mining cost = US$2,000/oz:
- Gold at US$4,000 → margin = US$2,000
- Gold at US$4,400 → gold rises 10%
- Margin increases from US$2,000 to US$2,400 = 20%
That helps explain why miners can rise much faster than the underlying metal.
AEM reached nearly +40% at its August peak before pulling back.
FNV.TO — Franco-Nevada
3-month gain: +19.44%
Franco-Nevada is also primarily a royalty and streaming company.
Its model provides exposure to commodity prices without directly operating most mines.
The chart shows relatively strong but more controlled performance compared with WPM and AEM.
FNV climbed to approximately +23–24% during August and finished near +19.4%.
ABX.TO — Barrick
3-month gain: +14.74%
Barrick also benefited from higher gold prices, but its share-price appreciation was smaller than the other three companies shown.
The chart indicates ABX peaked around +27% in August before giving back a meaningful portion of the gain.
That illustrates an important point: gold-price exposure alone does not determine miner performance. Production, costs, capital spending, reserve quality, country exposure and company-specific execution also matter.
Why Gold Stocks Rose Much More Than Gold
The chart demonstrates the operating leverage clearly:
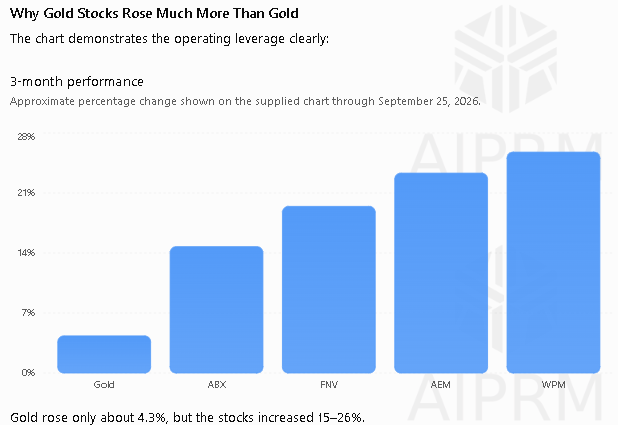
Approximate percentage change shown on the supplied chart through September 25, 2026.
0%7%14%21%28%GoldABXFNVAEMWPM
Gold rose only about 4.3%, but the stocks increased 15–26%.
The main reasons are:
- operating leverage to the gold price;
- expanding expected mining margins;
- stronger expected cash flows;
- investor rotation into gold equities;
- royalty/streaming companies benefiting from higher metal prices without equivalent increases in operating costs.
Key Takeaway
The three-month trend remains positive for precious metals, but momentum has moderated since the August highs.
Gold: +4.3%
WPM: +25.8%
AEM: +23.3%
FNV: +19.4%
ABX: +14.7%
The main factor to watch now is U.S. monetary policy. Continued rate increases and rising Treasury yields would work against gold, while renewed geopolitical deterioration or falling real yields would provide renewed support.
Leave a Reply
You must be logged in to post a comment.