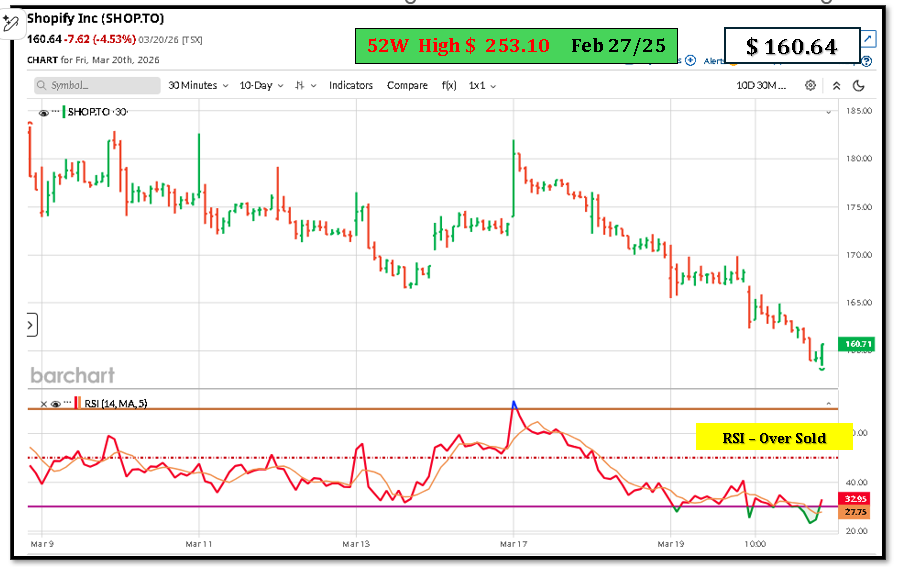
Author: Consultant

  • Fundamentals-driven explanation of technology stocks on the TSX,

    What “Technology” Means on the TSX

    On the Toronto Stock Exchange, the technology sector is structurally different from U.S. tech:

    • It is smaller, more concentrated, and less platform-driven
    • It is dominated by software, IT services, fintech, and e-commerce
    • There is very little hardware or semiconductor manufacturing
    • A handful of names account for most of the index weight

    As a result, TSX tech behaves less like NASDAQ tech and more like a growth-services sector.


    Core Characteristics of TSX Tech Stocks

    1. Business Models

    Most TSX tech companies fall into one of these categories:

    • Enterprise software / SaaS (recurring revenue, long sales cycles)
    • E-commerce enablement & platforms
    • IT services / consulting
    • Fintech & payments
    • Vertical-specific software (supply chain, logistics, HR, retail)

    They generally sell services, not physical products.


    2. Revenue & Profitability Profile

    • Many TSX tech firms do generate revenue, but:
      • Profitability is often thin or inconsistent
      • Cash flow is prioritized over aggressive expansion
    • Compared to U.S. peers:
      • Lower margins
      • Slower growth
      • Less pricing power

    This reflects Canada’s smaller domestic market and fewer global tech champions.


    3. Valuation Sensitivity

    TSX tech stocks are highly sensitive to interest rates because:

    • A large portion of value is based on future earnings
    • Higher rates compress valuation multiples
    • Lower rates expand multiples

    This makes the sector macro-driven, even when company fundamentals are unchanged.


    Why TSX Tech Has Been Volatile

    A. Interest Rate Environment

    • Rising rates (2022–2024) caused multiple compression
    • Even profitable companies saw share prices fall
    • Rate-cut expectations tend to drive sharp rebounds

    This volatility is structural, not company-specific.


    B. Earnings vs Expectations

    TSX tech stocks often decline not because:

    • Revenues are falling
      but because:
    • Growth is slower than previously priced in

    The sector is expectation-driven, not momentum-driven.


    C. Currency Exposure

    Many TSX tech firms:

    • Earn revenue in USD
    • Report in CAD

    This creates FX-driven earnings variability, which can:

    • Help margins when CAD is weak
    • Hurt comparability quarter-to-quarter

    Structural Strengths of TSX Tech

    Despite its challenges, the sector has real strengths:

    ✔ Recurring Revenue

    • High proportion of subscription or contract revenue
    • Better visibility than cyclical sectors

    ✔ Capital Discipline

    • Less “growth at all costs” behavior
    • Earlier focus on profitability than U.S. peers

    ✔ Global Niche Leaders

    • Several firms dominate specific verticals
    • Sticky customer relationships
    • High switching costs

    Structural Weaknesses of TSX Tech

    ✖ Limited Scale

    • Few companies reach true global platform status
    • Growth often plateaus earlier than U.S. peers

    ✖ Customer Concentration

    • Some firms rely on a small number of large clients
    • Creates earnings volatility

    ✖ Valuation Ceiling

    • Canadian tech rarely sustains extreme multiples
    • Institutional investors rotate out faster than in U.S. markets

    How TSX Tech Performs in a Portfolio

    From an asset-allocation perspective:

    RoleReality
    Growth engineModerate
    Dividend incomeLow
    Inflation hedgeWeak
    Rate-cut beneficiaryStrong
    VolatilityHigh

    TSX tech works best as:

    • A satellite allocation
    • Not a core defensive holding
    • Paired with financials, energy, or infrastructure

    Bottom Line (Unbiased View)

    TSX technology stocks are not broken, but they are structurally constrained.

    They:

    • Offer selective growth, not explosive growth
    • Require patience and valuation discipline
    • React strongly to rates, sentiment, and earnings expectations
    • Reward investors who focus on cash flow, balance sheets, and niche dominance

    This is a sector for analysis, not storytelling.

  • Calendar: Feb 9 – Feb 13

    Monday February 9

    China’s aggregate yuan financing, new yuan loans and foreign reserves

    Japan’s real cash earnings and bank lending

    (10:30 a.m. ET) Bank of Canada’s market participants survey for Q4.

    Earnings include: Apollo Global Management Inc., Becton Dickinson and Co., Cleveland-Cliffs Inc., PrairieSky Royalty Ltd., Silvercorp Metals Inc.


    Tuesday February 10

    (6 a.m. ET) U.S. NFIB Small Business Economic Trends Survey for January.

    (8:30 a.m. ET) U.S. retail sales for December. The Street is projecting a gain of 0.5 per cent from November and up 0.4 per cent year-over-year.

    (8:30 a.m. ET) U.S. employment cost index for Q4. Consensus is a rise of 0.8 per cent from Q3 and 3.5 per cent year-over-year.

    (8:30 a.m. ET) U.S. import prices for December.

    (10 a.m. ET) U.S. business inventories for November.

    Earnings include: Allied Properties REIT, AstraZeneca PLC, Coca-Cola Co., Crombie REIT, Finning International Inc., First Capital Realty Inc., Ford Motor Co., Gilead Sciences Inc., Intact Financial Corp., Lyft Inc., Marriott International Inc., Robinhood Markets Inc., S&P Global Inc.; Spotify Technology SA, Toromont Industries Ltd.


    Wednesday February 11

    China’s CPI and PPI for January.

    Japanese markets closed

    (8:30 a.m. ET) Canadian building permits for December.

    (8:30 a.m. ET) U.S. nonfarm payrolls and revisions for January. Consensus is a rise of 70,000 jobs with the unemployment rate remaining at 4.4 per cent.

    (1:30 p.m. ET) Bank of Canada’s Summary of Deliberations for the Jan. 28 decision is released.

    (2 p.m. ET) U.S. budget balance for January.

    Earnings include: AppLovin Corp., Cisco Systems Inc., Dayforce Inc., Kraft Heinz Co., Morguard REIT, Southern Copper Corp., T-Mobile US Inc.


    Thursday February 12

    (8:30 a.m. ET) U.S. initial jobless claims for week of Feb. 7. Estimate is 220,000, down 11,000 from the previous week.

    (8:45 a.m. ET) Bank of Canada Senior Deputy Governor Carolyn Rogers joins fireside chat in Toronto.

    (10 a.m. ET) U.S. existing home sales for January. Consensus is an annualized rate decline of 3.2 per cent.

    Earnings include: Agnico Eagle Mines Ltd., Airbnb Inc., Air Canada, Applied Materials Inc., Bombardier Inc., CAE Inc., Canadian Apartment Properties REIT, Canadian Tire Corp. Ltd., Cenovus Energy Inc., Definity Financial Corp., Fairfax Financial Holdings Ltd., Fortis Inc., H&R REIT, IGM Financial Inc., Keyera Corp., Mullen Group Ltd., New Gold Inc., Restaurant Brands International Inc.


    Friday February 13

    Euro zone’s real GDP and trade surplus

    (8:30 a.m. ET) Canada’s new motor vehicle sales for December. Estimate is a year-over-year decline of 8.5 per cent.

    (8:30 a.m. ET) U.S. CPI for January. Consensus is a rise of 0.3 per cent from December and up 2.5 per cent year-over-year.

    Earnings include: Colliers International Group Inc., Enbridge Inc., Magna International Inc., TC Energy Corp.

  • Saputo reports $220M profit in the third quarter, reversing last year’s $518M loss

    Saputo Inc. says its net earnings came in at $220 million during the third quarter, up from a loss of $518 million during the same period a year earlier.       

    The Montreal-based company attributed the swing in profit to the absence of an impairment charge recorded in its U.K. dairy division in the third quarter of last year. 

    On a per share basis, Saputo says its earnings amounted to 53 cents, up from a loss of $1.22 during the prior year quarter. 

    Saputo’s quarterly revenue came in at $4.89 billion, down from $4.99 billion a year earlier. 

    The company attributed the decline in revenue to lower U.S. dairy commodity pricing. 

    Saputo CEO Carl Colizza says in a news release that efficiencies from its modernized network drove robust cash generation during the quarter. 

    This report by The Canadian Press was first published Feb. 5, 2026.

  • TTCS Is Driven by a Few Heavyweights

    Here’s a clean, data‑driven breakdown of which TTCS components are contributing the most to the index’s uptrend, using the freshest available component and weight information from the search results.

    📊 1. TTCS Is Driven by a Few Heavyweights

    The S&P/TSX Capped Consumer Staples Index is extremely top‑heavy. Based on the iShares XST ETF (which directly tracks TTCS), the top weights are:

    CompanyWeight in TTCSImpact on Index
    Loblaw (L)25.46%#1 driver — any move in L heavily influences TTCS
    Alimentation Couche‑Tard (ATD)25.36%#2 driver — nearly equal influence to Loblaw
    Metro (MRU)14.89%#3 driver — meaningful but smaller
    George Weston (WN)12.75%#4 driver — solid contributor
    Saputo (SAP)8.56%Moderate contributor
    Remaining 8 companies~13% combinedMinimal impact

    Together, L + ATD + MRU + WN = ~78% of the entire index.

    So the uptrend is overwhelmingly driven by four stocks.

    📈 2. Which Stocks Are Actually Rising?

    From the TradingView component snapshot:

    • Loblaw (L): Slight daily pullback in the snapshot, but long‑term trend remains strong.
    • Alimentation Couche‑Tard (ATD): Also showed a small daily dip, but its multi‑year trend is one of the strongest in the TSX.
    • Metro (MRU): Typically stable, defensive, and steadily rising.
    • George Weston (WN): Historically strong performer tied to Loblaw.
    • Saputo (SAP): More volatile, but improving after prior weakness.

    Even if one of these names dips on a given day, the multi‑month trend for the group is upward — and because they dominate the index, TTCS rises with them.

    🧩 3. Contribution Summary

    Here’s the real impact hierarchy:

    Major Drivers (≈80% of index movement)

    1. Loblaw (L) — largest weight, steady long‑term uptrend
    2. Alimentation Couche‑Tard (ATD) — strong multi‑year compounder
    3. Metro (MRU) — stable, defensive, consistent
    4. George Weston (WN) — benefits from Loblaw’s strength

    Secondary Driver

    1. Saputo (SAP) — smaller but still meaningful

    Minimal Contributors

    Everything else in TTCS combined contributes less than any one of the top two stocks.

    🎯 Bottom Line

    The TTCS uptrend is almost entirely explained by:

    • Loblaw (L)
    • Alimentation Couche‑Tard (ATD)
    • Metro (MRU)
    • George Weston (WN)

    These four names account for nearly 80% of the index and have been in sustained long‑term uptrends, pulling TTCS upward with them.

  • Global software, data firms slide as AI disruption fears compound jitters over $600-billion capex plans

    Global technology and data stocks slid again on Friday, as ​a rout showed no signs of abating ‍on worries over the impact of powerful new AI models on their business and the billions hyperscalers plan to spend on their tech roll out this year.

    The risks to ‍software and ​data and analytics firms following the release of a new plug-in from Anthropic’s Claude has jolted world markets this week, just as some of the so-called hyperscalers unveil plans to spend over US$600-billion on their various AI rollouts this year.

    Amazon shares dropped 8 per cent in premarket trading ⁠on Friday after the company’s hefty capital expenditure plans deepened investor worries over Big Tech’s AI spending spree.

    London-listed data and analytics firm RELX, meanwhile, slid almost 5 per cent, while Sage fell nearly 4 per cent and Experian fell over 2 per cent.

    Shares in London Stock Exchange Group also fell further and ‌was set for a second ‍straight week of steep losses. The stock is down 7 per cent this week.

    Europe’s Capgemini ‍fell 3 per cent and Wolters Kluwer was down nearly ‌4 per cent.

    This week’s drawdown in AI-exposed shares has weighed on broader equity ⁠markets.

    Global shares are on track for the worst week since November, down 1.6 per cent.

    The broad S&P 500 ​index is off 2 per cent this week, while U.S. software and data services companies have burned around US$1-trillion in market value since January 28 alone.

    “Fresh AI bubble fears are surfacing after big tech companies massively increased their capex spending for the year – about US$650-billion across the four ​hyperscalers who have reported earnings over the last fortnight,” said Neil Wilson, Saxo UK Investor Strategist, in a note.

    The rout has been particularly acute in India. Indian software exporters plunged another 2 per cent on Friday and looked set to end a tumultuous week that has seen US$22.5-billion in market value losses.

    India’s IT index has shed almost 7 per cent this week.

    Investor nerves over potential ⁠AI‑driven disruption are coinciding with a growing tendency to punish big tech firms ⁠for signaling even heavier spending on the technology.

    Google parent Alphabet also upped its spending plans on Thursday, sending ‌its stock down as much as 8 per cent intra-day though they ended Thursday largely flat. Shares were trading flat in premarket trading on Friday.

    “A recurring theme is emerging: both Alphabet and Amazon delivered strong underlying business performance, driven by better-than-expected growth in cloud. But that hasn’t been enough to distract markets from ‌their ballooning capital investment plans,” said Aarin Chiekrie, equity analyst, Hargreaves Lansdown.

  • Canada loses 24,800 jobs in January, unemployment rate dips to 6.5%

    Canada unexpectedly lost 24,800 jobs in January but the unemployment rate dipped to a 16-month low of 6.5 per cent as fewer people looked for work, Statistics Canada indicated on Friday.

    Analysts had forecast a gain of 7,000 jobs and for the unemployment rate to remain unchanged at 6.8 per cent.

    Full-time employment in January rose by 44,900 jobs while part time employment fell by 69,700 positions.

    The unemployment rate – the lowest since the 6.5 per cent recorded in September, 2024 – fell across most major demographic groups, largely reflecting declines in the number of job searchers.

    The manufacturing sector lost 27,500 positions, most of them in the industrial heartland of Ontario, where some key industries have been hit by U.S. tariffs.

    Overall job losses in the manufacturing, educational services and public administration sectors outweighed gains in the information, business, agriculture and utilities sectors.

    Macklem says economy undergoing structural change, plays down chance of further rate cuts

    The Bank of Canada says the labour market is softening after the economy added a total of 181,000 new jobs from September through November. Canada created 10,100 jobs in December.

    The employment rate in January fell 0.1 percentage points to 60.8 per cent, the first such decline since August, 2025.

    The average hourly wage of permanent employees – a gauge closely tracked by the Bank of Canada to ascertain inflationary trends – dipped to a seven-month low of 3.3 per cent, down from the 3.7 per cent recorded in December.

    The central bank held its key policy rate steady at 2.25 per cent last week and said this was about the right level to keep inflation close to its 2-per-cent target. Money markets expect rates to stay on hold for the rest of the year.

  • TMX Group Limited Reports Results for The Fourth Quarter of 2025

    Key Highlights for the Fourth Quarter of 2025

    • Revenue increased by 16% from Q4/24. Revenue excluding Bond Indices, ETF Stream, Verity, and nuclear sector indices grew by 13% in Q4/25 compared with Q4/24 driven by a higher rate per contract in Derivatives Trading & Clearing (excluding BOX) and a 10% increase in MX trading volumes, growth in additional financings on both TSX and TSXV, continued double-digit growth in TMX VettaFi and TMX Trayport, and a 38% increase in equity trading volumes.
    • Operating expenses increased by 19% from Q4/24. Operating expenses excluding recent acquisitions of Bond Indices, ETF Stream, Verity and nuclear sector indices, BOX CAT-related expenses, dispute and litigation costs, amortization of acquired intangibles, integration costs, and acquisition and related costs, increased approximately 6%. The 6% increase reflects higher increased headcount and related costs, merit increase, higher severance, increased software license and subscription costs, and higher depreciation and amortization driven by the Post Trade Modernization project which went live on April 28, 2025.
    • TMX’s Board has approved a dividend increase of $0.02 or 9% to $0.24 per common share outstanding on March 6, 2026 to shareholders of record at the close of business on February 20, 2026. This represents TMX Group’s fourth dividend increase in two years.

    https://www.barchart.com/story/news/59224/tmx-group-limited-reports-results-for-the-fourth-quarter-of-2025

  • Saputo reports $220M profit in the third quarter, reversing last year’s $518M loss

    Saputo Inc. says its net earnings came in at $220 million during the third quarter, up from a loss of $518 million during the same period a year earlier.       

    The Montreal-based company attributed the swing in profit to the absence of an impairment charge recorded in its U.K. dairy division in the third quarter of last year. 

    On a per share basis, Saputo says its earnings amounted to 53 cents, up from a loss of $1.22 during the prior year quarter. 

    Saputo’s quarterly revenue came in at $4.89 billion, down from $4.99 billion a year earlier. 

    The company attributed the decline in revenue to lower U.S. dairy commodity pricing. 

    Saputo CEO Carl Colizza says in a news release that efficiencies from its modernized network drove robust cash generation during the quarter. 

    This report by The Canadian Press was first published Feb. 5, 2026.

  • ARC RESOURCES LTD. REPORTS YEAR-END 2025 RESULTS AND RESERVES

    ourth Quarter Results

    • Fourth quarter production averaged a record 408,382 boe (1) per day (58 per cent natural gas and 42 per cent crude oil and liquids (2) ), which included 118,898 barrels per day of crude oil and condensate production, the highest in ARC’s 30-year history. Production per share (3) increased 10 per cent compared to the fourth quarter of 2024.
    • ARC generated funds from operations of $874 million (4) ($1.52 per share (4) ) and cash flow from operating activities of $668 million ($1.16 per share (4) ).
      • ARC realized an average natural gas price of $3.77 per Mcf (4) , which is $1.43 greater than the average AECO 7A Monthly Index price.
    • Free funds flow was $415 million (4) ($0.72 per share (4) ), and net income was $260 million or $0.45 per share. ARC distributed $257 million ($0.45 per share) to shareholders through the base dividend and share repurchases, and allocated the remainder to debt reduction.
      • ARC declared dividends of $120 million ($0.21 per share (4) ) and repurchased 5.1 million common shares for $137 million under its normal course issuer bid (“NCIB”).
    • ARC invested $459 million in capital expenditures (4) during the fourth quarter, which contributed to total capital expenditures of $1.9 billion in 2025, which was within Company guidance.
    • Subsequent to December 31, 2025, ARC executed an agreement to purchase assets in the Kakwa area of Alberta for approximately $160 million. The transaction is expected to close in February 2026.
    • Net debt (4) decreased by $191 million compared to the third quarter of 2025. As at December 31, 2025, net debt was $2.9 billion or 0.9 times funds from operations (4) .

    https://www.barchart.com/story/news/58667/arc-resources-ltd-reports-year-end-2025-results-and-reserves