Here’s a straightforward explanation of why George Weston Limited (WN.TO) has been rising over the past ~25 trading days (roughly the last month on the TSX):
1. Stock Has Been Near Technical Support & Sector Strength
WN.TO has traded up from lower levels closer to its 52-week low over recent months toward the upper part of its range, which often attracts technical buyers. Historically the stock’s 52-week range is roughly C$72–104 and it has been trading closer to the higher end lately, indicating renewed momentum.
Canadian consumer staples stocks, including grocery and retail names, have seen moderate sector strength, which tends to lift large staples like Weston. The broader S&P/TSX Consumer Staples Index has been positive over the past month.
2. Upcoming Earnings Catalyst
In early **February 2026, George Weston announced that it will release its Q4 2025 and full year results on March 4, 2026. Investors often begin buying ahead of earnings releases in anticipation of a strong print or positive guidance.
This kind of pre-earnings positioning can support share price gains as traders reduce cash before a key news event.
3. Dividend and Yield Appeal
Weston declared dividends on both common and preferred shares; even though the yield isn’t exceptionally high, the steady dividend supports demand from income-focused investors. Dividend-support charts on most trading platforms show this as a reason for holding or increasing positions.
Stable dividend policies can make consumer staples stocks attractive when markets are uncertain.
4. Long-Term Fundamentals and Institutional Support
Weston controls a major stake in both Loblaw (Canada’s largest grocery/retailer) and Choice Properties (real estate), which provides diversified cash flows that appeal to investors. While there hasn’t been specific new news in the past 25 days, this underlying business mix underpins confidence.
Some analyst coverage and institutional buying patterns tended to favor staples after broader market volatility, which can help stocks like WN.TO trend up. (General sector/analyst influence explicitly tied to this period is limited in public news feeds.)
5. Limited Negative News
There hasn’t been major negative press or earnings misses recently for Weston, while many consumer names have avoided downgrades or headlines that would push the stock down. In contrast, absence of negative catalysts often allows a gradual drift upward alongside broader market flows.
Summary — Key Reasons for the Recent Price Increase
Price has likely risen due to a combination of:
Technical momentum and movement back toward resistance after being nearer support.
Positioning ahead of upcoming earnings scheduled in early March.
Dividend stability and yield appeal supporting ongoing demand.
Broad sector strength in consumer staples helping staples stocks outperform.
No recent negative news, allowing upward drift to continue.
Overall: The rise over the past ~25 days reflects technical and anticipatory buying, supported by defensive sector resilience and upcoming earnings visibility — not one single blockbuster catalyst.
BRAMPTON, Ontario, Feb. 19, 2026 (GLOBE NEWSWIRE) — Loblaw Companies Limited (TSX: L) today announced a new collaboration with Google that will offer Canadians a brand new way to shop through conversational AI.
Loblaw will soon allow Canadians to shop for their favourite health, beauty and apparel products directly through AI Mode in Google Search and Google’s Gemini app. Loblaw is the first large retailer to make products available for purchase directly through Google’s AI-mode in Canada, and it is also a glimpse into the future of agentic commerce.
This is another step forward for Loblaw as it seeks to redefine its customer shopping journey by enabling Canadians to connect their AI-led discovery online to the products they crave. From simplifying seasonal shopping to enhancing personal beauty routines, simple chats will help make shopping even faster and easier.
This type of commerce stream is made possible thanks to Google’s conversational AI platforms, as well as through the emergence of a new Universal Commerce Protocol (UCP) – an open, standardized way for different commerce systems and AI agents to talk to one another that is coming on stream in Canada. UCP helps to safely and securely facilitate shopping, booking, and payments across different channels.
As part of this collaboration, Loblaw will also scale its use of Google Cloud’s Vertex AI platform. Over the last several years, Loblaw has leveraged Google Cloud across many of its core retail functions, including merchandising, supply chain, the store floor, and beyond. Further scaling the use of this platform will help accelerate its continued transformation into an AI-native enterprise.
“Our purpose is to help Canadians Live Life Well, and this most recent collaboration with Google is a clear demonstration of our commitment to leveraging technology and artificial intelligence to achieve that vision,” said Per Bank, President and CEO, Loblaw Companies Limited. “These integrations are making Loblaw an even better place to shop and work by fostering innovation.”
“We see agentic commerce as a natural evolution of how our customers want to shop. By empowering our colleagues and making shopping simpler and more personalized for customers, we are solidifying our position as a true pioneer in Canadian AI innovation.” said Lauren Steinberg, Chief Digital Officer at Loblaw Companies Limited.
“We are seeing a generational shift where AI is becoming the foundational engine for business transformation. Loblaw’s commitment to scaling AI across its entire enterprise is a clear roadmap for how retailers can convert technical innovation into measurable value. By optimizing everything from merchandising to inventory management, they are proving that AI-native systems are the key to driving both operational efficiency and a superior customer experience at scale.” said Karthik Narain, Chief Product and Business Officer, Google Cloud.
Saputo Inc. says its net earnings came in at $220 million during the third quarter, up from a loss of $518 million during the same period a year earlier.
The Montreal-based company attributed the swing in profit to the absence of an impairment charge recorded in its U.K. dairy division in the third quarter of last year.
On a per share basis, Saputo says its earnings amounted to 53 cents, up from a loss of $1.22 during the prior year quarter.
Saputo’s quarterly revenue came in at $4.89 billion, down from $4.99 billion a year earlier.
The company attributed the decline in revenue to lower U.S. dairy commodity pricing.
Saputo CEO Carl Colizza says in a news release that efficiencies from its modernized network drove robust cash generation during the quarter.
Canadian Tire Corp. Ltd. reported its fourth-quarter revenue rose compared with a year earlier as chief executive Greg Hicks says the retailer had one of the best holiday seasons in recent memory.
The retailer says revenue for the quarter totalled $4.55 billion, up from $4.20 billion a year earlier.
The increase came as consolidated comparable sales rose 4.2 per cent, while comparable sales at its namesake Canadian Tire stores gained 2.7 per cent.
SportChek comparable sales rose 9.5 per cent and Mark’s comparable sales added 7.2 per cent.
Canadian Tire says its net income attributable to shareholders from continuing operations amounted $211.0 million or $3.96 per diluted share, down from $365.2 million or $6.54 per diluted share a year earlier.
On an normalized basis, Canadian Tire says it earned $4.47 per diluted share in its latest quarter, up from $3.24 per diluted share a year earlier.
On February 20, 2026, the U.S. Supreme Court issued a 6-3 ruling striking down a significant portion of President Donald Trump’s sweeping tariffs. These tariffs were imposed using the International Emergency Economic Powers Act (IEEPA) of 1977, which the Court ruled does not authorize the president to impose tariffs. Chief Justice John Roberts wrote the majority opinion, joined by Justices Amy Coney Barrett, Neil Gorsuch, and the Court’s three liberal justices. Justices Clarence Thomas, Samuel Alito, and Brett Kavanaugh dissented.
The decision invalidates tariffs enacted under IEEPA, including:
“Reciprocal” tariffs applied to dozens of trading partners (often described as addressing trade deficits declared a national emergency).
Tariffs on goods from Canada, Mexico, and China (initially tied to a declared emergency over fentanyl and drug trafficking, with rates like 25% on Canada, later increased in some cases to 35%).
This does not affect all tariffs—those imposed under other authorities (e.g., Section 232 for national security or Section 301 for unfair trade practices) remain in place, and the administration may seek to shift or reimpose measures under alternative laws.
Impact on the United States:
Economic relief for consumers and businesses — These tariffs had raised import costs, contributing to higher prices for goods and inflation pressures. Striking them down could lower costs for American importers, manufacturers reliant on foreign inputs, and consumers. Estimates suggest over $175 billion in collected duties may now face refund claims from importers.
Broader economic effects — Prior tariffs were projected to generate substantial revenue (hundreds of billions over a decade) but also imposed costs estimated in the trillions long-term due to higher prices and disrupted supply chains. The ruling removes a major source of uncertainty that had spooked markets and businesses.
Policy setback — This represents a rare rebuke from the conservative-leaning Court to Trump’s executive power expansion on trade, a core part of his economic agenda. It limits unilateral presidential tariff authority under emergency laws, reinforcing Congress’s constitutional role in levying duties.
Potential next steps — The administration could pivot to other legal bases for tariffs, though those often require more process, justification, or congressional involvement, potentially slowing implementation.
Impact on Canada:
Significant positive development — Canada faced targeted high tariffs (e.g., 25-35% on various goods) under the fentanyl-related emergency declaration, straining cross-border trade. The ruling eliminates these IEEPA-based duties, easing pressure on Canadian exporters (especially in sectors like autos, energy, steel, and agriculture integrated with U.S. supply chains via the USMCA).
Trade relationship stabilization — The tariffs had heightened tensions and prompted retaliatory measures or diplomatic friction. Removing them reduces immediate economic harm to Canadian businesses and consumers, potentially lowering costs for goods flowing both ways and supporting jobs in export-dependent industries.
Broader context — While USMCA provides some baseline protections, the struck-down tariffs went beyond standard frameworks. Canada (along with Mexico) benefits from restored predictability in North American trade, though other U.S. tariffs (if reimposed differently) could still pose risks.
Overall, the ruling curbs aggressive unilateral trade actions, likely benefiting integrated economies like those of the U.S. and Canada by reducing artificial trade barriers and costs in the short term. Markets and businesses may see immediate relief, though long-term trade policy remains fluid as the administration responds.
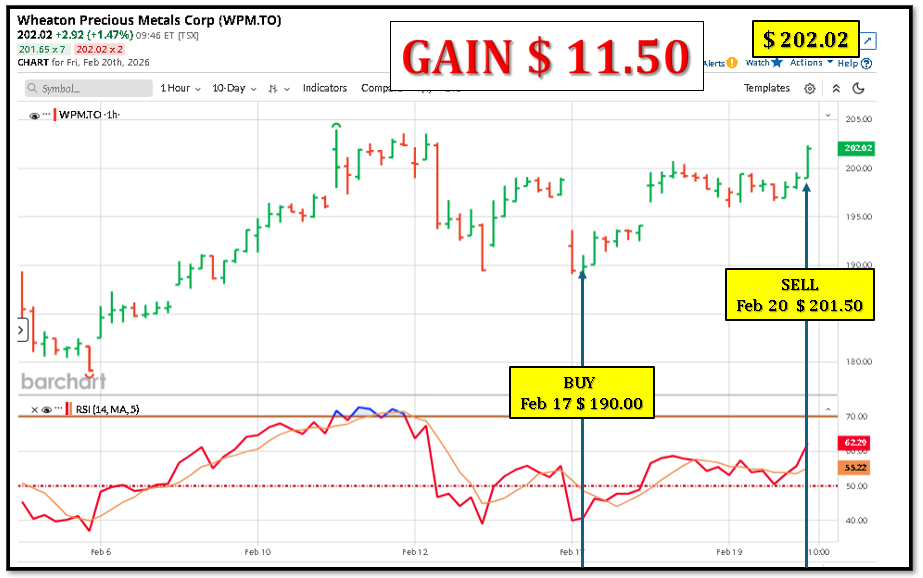
Wheaton Precious Metals Corp is a precious metal streaming company. Its reportable segment includes: Gold, Silver, Palladium, Platinum, Cobalt, and Other. It generates its revenue from the sale of precious metals (gold, silver and palladium) and cobalt.
6M Daily (Feb 12/26)
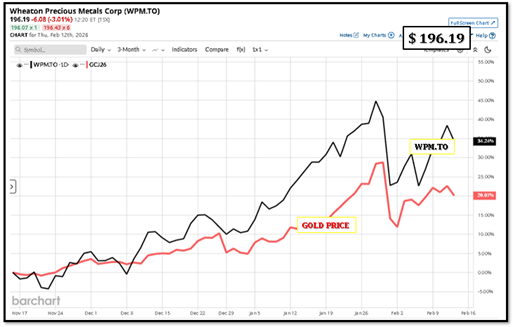
Track Gold Prices
Feb 12/26: Gold prices slipped on Thursday as January’s jobs data bolstered expectations that the Federal Reserve will hold interest rates steady for longer than previously anticipated.
Traders currently assign a 94.1 percent chance that the Fed will leave rates unchanged at its upcoming March meeting, according to the CME Group’s FedWatch Tool.
Spot gold slipped 0.2 percent to $5,073.59 an ounce while U.S. gold futures were down 0.1 percent at $5,093.86.
Data released on Wednesday showed U.S. non-farm payroll employment jumped by 130,000 jobs in January after rising by a downwardly revised 48,000 jobs in December.
The jobless rate dipped from 4.4 percent to 4.3 percent, but revised data showed the world’s largest economy generated far fewer jobs in 2024 and 2025 than was initially estimated.
The dollar was slightly lower in European trade ahead of the release of U.S. reports on weekly jobless claims and existing home sales later in the day.
On Friday, the Labor Department is scheduled to release a report on consumer price inflation that may shed additional light on the outlook for rates.
Analysts warn that a softer CPI print on Friday coupled with the jobs data released on Wednesday could see gold make a foray back below the $5000/oz mark.
Kinaxis’s moat rests on four interlocking pillars, each reinforcing the others:
1. Switching Costs (the strongest pillar) Supply chain planning software is deeply embedded in enterprise operations — connected to ERP systems, demand signals, supplier networks, and financial planning. Ripping out Kinaxis means years of re-implementation, retraining, and risk. Large enterprises (aerospace, auto, pharma) do not switch lightly. This creates extremely high churn protection, and Kinaxis has historically maintained strong customer retention rates in its long-term contracts.
2. Patented Concurrent Planning Technology Kinaxis combines its patented concurrency technique with a human-centered approach to AI to empower businesses of all sizes to orchestrate their end-to-end supply chain network, from multi-year strategic planning through execution. Kinaxis No competitor has directly replicated this architecture — it’s the reason Kinaxis can show the real-time impact of any decision across the entire supply chain simultaneously.
3. Brand & Trust in Complex Industries Kinaxis was named the only vendor to achieve the 2024 Gartner Peer Insights Customers’ Choice for Supply Chain Planning Solutions Kinaxis — a peer-validated signal of trust that’s hard to manufacture. Serving brands like ExxonMobil, General Motors, Pfizer, and Colgate-Palmolive creates reference-customer flywheel effects in sales cycles.
4. Agentic AI Momentum (emerging moat layer) Kinaxis launched new generative AI and agentic AI capabilities under Maestro, which were available for subscription to initial customers in the second half of 2025 — with management claiming these further extend their lead over competitors. Business Wire This is important: if Kinaxis can embed AI deeply enough into existing workflows, switching costs compound further.
Moat Rating: Medium-Wide — strong in the installed base, but being tested at the new business frontier where AI-native competitors (o9 especially) are winning deals.
Moat Risks to Watch
The primary threat isn’t that existing customers leave — it’s that AI-native competitors win new logos at a faster rate, gradually shifting market share over 5–10 years. Key risks:
Revenue growth slowing: Kinaxis’s revenue growth is expected to slow to ~14% through 2026, while the wider industry is forecast to grow at ~18% per year arXiv — a meaningful gap suggesting some new business headwinds.
CEO transition risk: Kinaxis has been operating with an interim CEO (Bob Courteau) rather than a permanent one, which introduces execution uncertainty during a critical AI investment cycle.
AI perception gap: Even if Kinaxis’s AI is technically competitive, being perceived as an “incumbent adding AI” vs. “AI-native” can hurt in competitive sales processes, particularly with tech-forward buyers.
Part 2: Valuation & Stock Thesis
Current Picture (as of Feb 2026):
KXS is currently trading around C$123.77, with an average analyst 12-month price target of C$212, representing roughly 71% upside potential. The high target is C$245 and the low is C$200. Stanford
From a DCF perspective, KXS is estimated to be trading below fair value — with the stock at ~C$175 vs. an estimated fair value of ~C$283, suggesting it is significantly undervalued on a cash flow basis. However, on a P/E basis, KXS trades at ~102.7x earnings, compared to a peer average of 36.2x and a Canadian software industry average of 49.3x. Oxford Insights
This creates a classic “two stories” valuation tension:
Lens
Signal
Implication
DCF / Cash Flow
Below fair value
Undervalued — buy
P/E Ratio
102x vs. 36x peer avg
Expensive — cautious
Analyst Consensus
71% upside to target
Strong buy signal
Revenue growth vs. peers
14% vs. 18% industry
Mild concern
Rule of 40
Achieved 4 consecutive quarters
Healthy SaaS business
The Bull Case: Kinaxis is a high-quality SaaS business with sticky enterprise customers, improving profitability (25% EBITDA margins), record Q2 2025 new business with growth balanced between new wins and expansions Kinaxis, and a stock that has been meaningfully de-rated from its peaks — creating an attractive entry point if you believe the AI transition succeeds.
The Bear Case: The stock still carries a premium multiple for a business whose growth is decelerating relative to its industry. If AI-native competitors accelerate market share gains in new deals and growth slips further toward ~10%, the premium compression could be painful.
Bottom Line
KXS is best characterized as a high-quality compounder going through an AI transition — not a high-growth AI pure-play. The moat is real but being stress-tested. The valuation, after a meaningful drawdown from highs, is more compelling than it was, and the analyst community is broadly bullish with a wide consensus around ~C$212–231 targets.
The key question for any investor is simply: does Maestro’s agentic AI close the perception gap with o9 fast enough to reaccelerate new business wins? If yes, the stock has significant upside from current levels. If not, modest multiple compression continues.
What is o9 Solutions?
o9 Solutions is a Dallas-based enterprise software company founded in 2009 that sells a cloud-hosted planning suite branded as the “Digital Brain” for integrated business planning (IBP), demand and supply planning, supply chain analytics, and revenue growth management. Amazonaws
It was co-founded by Sanjiv Sidhu (previously founder of i2 Technologies, an early supply chain pioneer) and Chakri Gottemukkala, who is the current CEO.
How It Works — The “Digital Brain”
The platform is built around two core technical differentiators:
Enterprise Knowledge Graph (EKG): An in-memory “Graph-Cube” store that models business entities and hierarchies, fed by batch ETL and real-time APIs. Amazonaws Think of it as a living map of your entire business — products, suppliers, customers, factories — all connected and queryable in real time.
AI/ML Layer: The platform is augmented with specialized AI agents, self-learning models, and self-service innovation tools that enable faster, smarter decision-making across planning horizons and business domains. Lightcast
Scale & Traction
As of 2025, o9 services some of the largest companies in the world, including Walmart, Nike, Estée Lauder, Starbucks, Nestlé, Google, Sony, Samsung, Caterpillar, and Bridgestone. Stanford HAI
ARR grew 37% year-over-year in 2024, and o9 reported 60% growth in new client acquisition in Q1 2025. Stanford HAI They completed more than 30 go-lives worldwide in 2025 alone. IEEE Spectrum
Financials & Ownership (Private Company)
o9 was bootstrapped for over a decade before taking its first external investment from KKR in 2020 at a $1 billion valuation. Later, General Atlantic, KKR, and Generation Investment Management invested at a $2.7 billion valuation, and the most recent round valued o9 at $3.7 billion. Stanford HAI Total funding raised is ~$536M. The company remains private.
Why It Matters to Kinaxis
o9 is arguably Kinaxis’s most dangerous competitive threat right now because:
It’s winning new logos at 60% growth — faster than Kinaxis
It was named a Leader in the 2025 Gartner Magic Quadrant for Supply Chain Planning Solutions Oxford Insights — the same quadrant Kinaxis has dominated for 11 years
o9 is actively positioning itself to capture SAP APO customers migrating away from that legacy platform, which SAP plans to sunset in 2027 Stanford HAI — a massive replacement cycle that both o9 and Kinaxis are competing for
In short, o9 is the AI-native challenger most likely to put pressure on Kinaxis’s new business pipeline over the next 3–5 years.
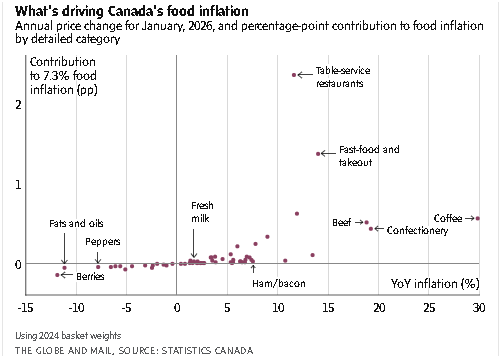
Canada holds the unwelcome title of having the highest rate of food inflation in the G7. And while that’s putting added price pressure on Canadian consumers, a few key items are driving much of the pain.
The annual rate of food inflation climbed by 7.3 per cent in January, according to numbers released this week by Statistics Canada, more than double the pace from six months ago.
By far the biggest driver of annual price increases was the end of the tax holiday the former Trudeau government put in place for restaurants, snacks and other food items from mid-December, 2024 to mid-February, 2025.
In the same way top-line food prices declined 0.6 per cent a year ago because of the tax holiday, the end of that break is having the reverse statistical effect now.
But several grocery items are soaring in price for other reasons. After years of declining cattle herds, beef prices jumped 18.8 per cent in January from the year before, while low coffee yields pushed java prices up 29.8 per cent. (By comparison, in the U.S. beef increased 15 per cent and coffee jumped 18 per cent.)
And because Statscan gives different weightings in calculating inflation that are proportional to the share of household spending on each item, those particular price increases matter a lot to overall food inflation.
Think of it this way. If pestilence wiped out mushroom crops, supply shortfalls would make mushrooms a lot more expensive. But since households don’t spend all that much on mushrooms, even skyrocketing mushroom prices would do little to nudge the overall inflation needle.
However, Canadians do spend a large share of their money dining out, or buying beef products and coffee, so rising prices for them have an outsized effect on food inflation.
Of course, none of this changes the fact that shoppers are still experiencing sticker shock across grocery aisles – lettuce prices climbed 6.7 per cent, while soup was up 6.3 per cent.
At least mushroom prices climbed less than 1 per cent.