Author: Consultant

  • TSX Watchlist: July 13–17, 2026

    Summary

    • Wednesday, July 15 is the highest-risk session: the Bank of Canada rate decision, Monetary Policy Report, China’s economic data and U.S. producer inflation are all scheduled.
    • U.S. CPI on Tuesday will influence bond yields, Federal Reserve expectations and TSX technology, utilities, REITs and financials.
    • Strait of Hormuz developments remain the main geopolitical risk. Escalation would likely support Canadian energy shares but hurt airlines, consumer stocks and interest-rate-sensitive sectors.
    • China’s Q2 GDP and June activity data will be important for TSX materials, mining and commodity producers.
    • U.S. bank and technology earnings could affect global risk appetite and spill over into Canadian financial and technology stocks.

    Event Calendar and Expected TSX Impact

    DateEventMain TSX exposurePotential market effect
    Mon., July 13Outcome of U.S.–Iran/Oman talks; Fed speakersEnergy, airlines, industrialsOil and risk-sentiment volatility
    Tue., July 14U.S. June CPI; Fed Chair congressional testimonyTechnology, REITs, utilities, banksMajor bond-yield and valuation catalyst
    Wed., July 15Bank of Canada decision and Monetary Policy ReportBanks, REITs, utilities, telecoms, CADLargest domestic catalyst
    Wed., July 15China Q2 GDP, industrial production and retail salesMaterials, mining, energyCommodity-demand signal
    Wed., July 15U.S. June PPI; Fed Beige BookTechnology, financials, industrialsInflation and growth expectations
    Wed., July 15Canadian manufacturing and wholesale salesIndustrials, transports, banksDomestic growth indication
    Thu., July 16U.S. retail sales and jobless claimsConsumer, financials, technologyU.S. demand and rate outlook
    Fri., July 17U.S. industrial production, housing starts, consumer sentiment and import pricesMaterials, industrials, financialsGrowth and inflation confirmation
    Fri., July 17Canadian foreign securities transactionsCAD, banks, broad TSXCapital-flow signal

    Key Drivers

    1. Bank of Canada decision — Wednesday, July 15

    The Bank of Canada will announce its policy rate at 9:45 a.m. ET and publish a new Monetary Policy Report. The overnight rate is currently 2.25%, and the consensus expectation is for no change.

    The rate decision itself may therefore be less important than the Bank’s language on:

    • May’s elevated inflation;
    • energy-price volatility;
    • economic recovery;
    • U.S. trade uncertainty;
    • the future balance between rate cuts and rate increases.

    TSX reaction framework

    Bank of Canada messageLikely sector reaction
    Dovish: inflation expected to ease; weak growth emphasizedPositive for REITs, utilities, telecoms and growth stocks; CAD may weaken
    Neutral: rate unchanged with balanced risksLimited index reaction; sector-specific trading
    Hawkish: energy inflation and inflation expectations emphasizedBond yields and CAD could rise; negative for REITs, utilities and technology; mixed for banks

    The latest economist polling indicates the Bank is widely expected to hold rates steady through much of 2026, but an unexpected hawkish tone could still generate significant volatility.


    2. U.S. CPI — Tuesday, July 14

    The U.S. June CPI report is scheduled for 8:30 a.m. ET.

    Headline inflation may decline because gasoline prices dropped after the earlier easing in U.S.–Iran tensions. However, core inflation is more important because it excludes food and energy and better reflects underlying price pressure.

    TSX implications

    Lower-than-expected core CPI

    • U.S. and Canadian bond yields could fall.
    • Positive for Shopify, Constellation Software and other high-duration technology shares.
    • Positive for utilities, telecoms and REITs.
    • Potentially negative for bank net-interest-margin expectations.

    Higher-than-expected core CPI

    • Bond yields could rise.
    • Technology and rate-sensitive sectors could weaken.
    • Banks may initially benefit from higher-rate expectations, although recession concerns could offset that benefit.
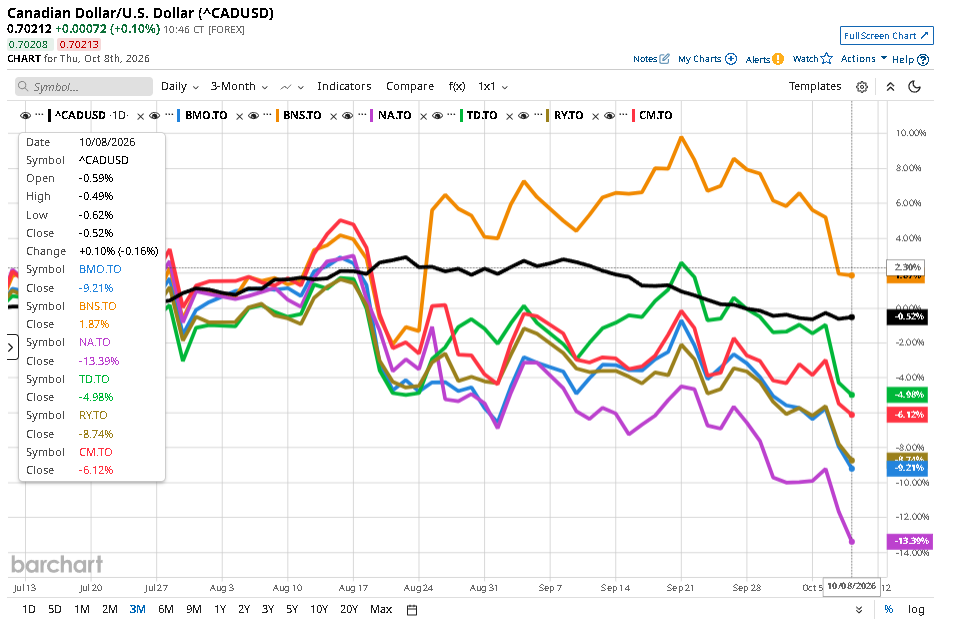
    • The U.S. dollar could strengthen, potentially weakening the Canadian dollar.

    The key distinction is between lower headline inflation caused by gasoline and genuine improvement in core inflation.


    3. Strait of Hormuz and U.S.–Iran tensions

    This remains the largest unscheduled risk.

    WTI ended the previous week near US$71.41 per barrel, supported by renewed U.S.–Iran conflict, attacks on shipping and higher maritime insurance costs. Commercial traffic through the Strait remained constrained despite continued negotiations.

    The United States has demanded that Iran publicly commit to safe commercial passage through the Strait. Discussions involving Iran and Oman therefore have the potential to materially move oil when markets reopen.

    TSX impact

    DevelopmentLikely TSX effect
    Iran agrees to secure passage; tanker traffic normalizesOil falls; energy stocks weaken; airlines and consumer stocks benefit
    Negotiations continue without resolutionOil remains volatile around an elevated risk premium
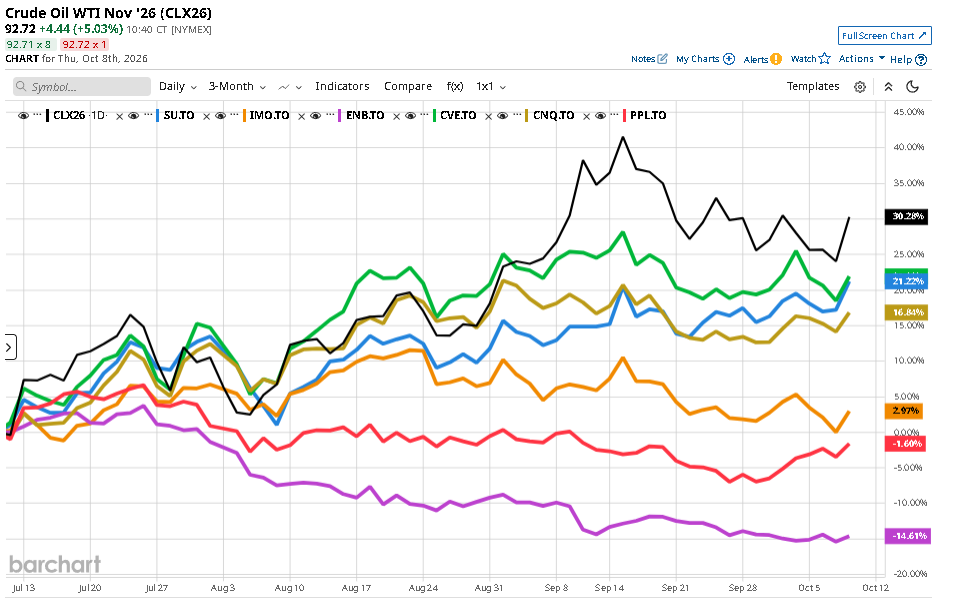
    Additional tanker attacks or military strikesOil rises; CNQ, Suncor, Imperial Oil and Cenovus likely outperform
    Full disruption of Hormuz trafficStrong energy rally, but broader TSX could weaken due to inflation and recession concerns

    A rise in oil is not automatically positive for the whole TSX. Energy may rise while technology, consumer discretionary, transportation, utilities and REITs decline because of higher inflation and bond yields.


    4. China economic data — Wednesday, July 15

    China is scheduled to publish:

    • second-quarter GDP;
    • June industrial production;
    • retail sales;
    • fixed-asset investment;
    • housing-market data.

    China’s official statistical release calendar confirms that quarterly economic performance data are released in July.

    TSX exposure

    China is an important marginal buyer of industrial commodities. Results will therefore affect:

    • copper producers;
    • diversified miners;
    • steel and metallurgical coal;
    • fertilizer producers;
    • oil-demand expectations.

    Stronger data: supportive for materials and energy, particularly copper-sensitive companies.

    Weaker data: negative for mining and commodity prices, although expectations of Chinese stimulus could partially offset the initial decline.

    The most important figures for the TSX may be industrial production, fixed investment and property activity, rather than headline GDP alone.


    5. U.S. PPI and Canadian activity data — Wednesday

    The U.S. Producer Price Index is scheduled for 8:30 a.m. ET on July 15.

    PPI measures inflation at the producer level and can indicate future pressure on consumer prices and corporate margins.

    On the same morning, Canada will release May manufacturing shipments and wholesale trade data.

    TSX impact

    • Strong Canadian manufacturing data would support the domestic-growth outlook and industrial stocks.
    • Weak data would reinforce concerns about tariffs, exports and business investment.
    • High U.S. PPI could raise bond yields and pressure rate-sensitive TSX sectors.
    • Low PPI would support the argument that inflation is moderating.

    6. U.S. retail sales — Thursday, July 16

    U.S. retail sales are important because the United States is Canada’s largest export market.

    Strong retail sales

    • Positive for Canadian manufacturers and exporters.
    • Supportive for railways and industrials.
    • Could raise yields if markets interpret the data as reducing the need for Fed easing.

    Weak retail sales

    • Negative for Canadian cyclicals and exporters.
    • Potentially positive for technology and REIT valuations if bond yields fall.
    • Could increase recession concerns if weakness is broad.

    The TSX reaction will depend on whether the market prioritizes growth or interest-rate relief.


    7. U.S. bank and technology earnings

    Major U.S. financial institutions—including JPMorgan, Bank of America, Citigroup, Goldman Sachs and Morgan Stanley—are scheduled to report during the week. Semiconductor equipment producer ASML and chip manufacturer TSMC are also major global catalysts.

    Canadian spillovers

    U.S. bank results

    Watch for:

    • loan-loss provisions;
    • credit-card delinquencies;
    • commercial-real-estate exposure;
    • investment-banking revenue;
    • net interest margins.

    Poor credit-quality commentary could pressure Royal Bank, TD, BMO, Scotiabank, CIBC and National Bank even without Canadian-specific news.

    Semiconductor results

    Strong AI demand and capital-spending guidance could support:

    • Shopify through broader technology sentiment;
    • Celestica through data-centre and hardware demand;
    • the overall TTTK technology index.

    Weak semiconductor orders or cautious guidance could reverse recent technology-sector strength.


    Risk Ranking

    RankCatalystTSX sensitivity
    1Bank of Canada decision and Monetary Policy ReportVery high
    2U.S.–Iran/Hormuz developmentsVery high
    3U.S. CPIVery high
    4China GDP and industrial dataHigh
    5U.S. PPI and retail salesModerate–high
    6U.S. earnings seasonModerate–high
    7Canadian manufacturing and wholesale dataModerate

    Scenarios for the Week

    ScenarioConditionsProbable TSX effect
    BullBoC remains neutral/dovish; U.S. core inflation softens; China data are firm; Hormuz tensions ease without an oil collapseBroad TSX advance led by technology, financials and materials
    BaseBoC holds with balanced language; inflation data are mixed; oil remains near its current rangeRange-bound TSX with significant sector rotation
    BearBoC turns hawkish; U.S. core inflation surprises higher; China disappoints; Hormuz conflict escalatesEnergy may outperform, but broad TSX pressured by higher yields and weaker risk appetite

    Actionable Takeaways

    • Wednesday is the pivotal day because Canadian monetary policy, China’s growth data and U.S. producer inflation arrive within hours of each other.
    • For energy, monitor tanker traffic and official statements from Iran, Oman and the United States—not merely headlines about negotiations.
    • For technology, utilities and REITs, the key variable is the direction of North American bond yields following CPI and the Bank of Canada decision.
    • For materials, China’s industrial and property data will be more important than Canadian domestic releases.
    • For financials, watch both the Bank of Canada’s rate outlook and credit-quality commentary from U.S. bank earnings.
    • The base case is a volatile, sector-rotation-driven week, rather than a uniform rise or decline across the TSX.

  • Economic Calendar: July 13 – July 17

    Monday July 13

    China’s trade balance, aggregate yuan financing and new yuan loans

    (2 p.m. ET) U.S. budget balance for June.

    Earnings include: Fastenal Co.; PrairieSky Royalty Ltd.


    Tuesday July 14

    Japan’s industrial production

    (6 a.m. ET) U.S. NFIB Small Business Economic Trends Survey for June.

    (8:15 a.m. ET) U.S. ADP Employment (4-week average change) for week of June 27.

    (8:30 a.m. ET) U.S. CPI for June. The Street is expecting a month-over-month decline of 0.1 per cent and a rise of 3.9 per cent year-over-year.

    (10 a.m. ET) U.S. Fed’s Monetary Policy Report to the House Financial Services Committee.

    Earnings include: Bank of America; Citigroup Inc.; Goldman Sachs Group Inc.; JP Morgan Chase & Co.; Wells Fargo & Co.


    Wednesday July 15

    China’s real GDP, retail sales, industrial production and fixed asset investment

    Japan’s core machine orders

    Euro zone’s industrial production

    (5 a.m. ET) Canada’s existing home sales and average prices for June. Estimates are month-over-month declines of 1.0 per cent and 0.1 per cent year-over-year, respectively.

    (5 a.m. ET) Canada’s MLS Home Price Index for June. Estimate is a year-over-year decline of 3.5 per cent.

    (8:30 a.m. ET) Canada’s manufacturing sales and new orders. Estimates are month-over-month rises of 1.1 per cent and 0.5 per cent, respectively.

    (8:30 a.m. ET) Canada’s wholesale trade for May. Estimate is a month-over-month slide of 0.7 per cent.

    (8:30 a.m. ET) Canada’s new motor vehicle sales for May. Estimate is a year-over-year drop of 3.0 per cent.

    (8:30 a.m. ET) U.S. PPI Final Demand for June. The Street is projecting a month-over-month decline of 0.1 per cent but a 6.1-per-cent year-over-year increase.

    (9:45 a.m. ET) Bank of Canada’s policy announcement and Monetary Policy report (with press conference to follow).

    (10 a.m. ET) U.S. Fed’s Monetary Policy Report to the Senate Banking Committee.

    Earnings include: ASML Holding; Bank of New York Mellon Corp.; BlackRock Inc.; Cintas Corp.; Cogeco Inc.; Cogeco Communications Inc.; Johnson & Johnson; Morgan Stanley; PNC Financial Services Group Inc.


    Thursday July 16

    Euro zone’s trade surplus

    (8:15 a.m. ET) Canadian housing starts for June. Estimate is an annualized rate decline of 0.5 per cent.

    (8:30 a.m. ET) U.S. initial jobless claims for week of July 11. Estimate is 222,000, up 7,000 from the previous week.

    (8:30 a.m. ET) U.S. retail sales for June. The Street is projecting a month-over-month rise of 0.3 per cent.

    (10 a.m. ET) U.S. NAHB Housing Index for July.

    (10 a.m. ET) U.S. business inventories for May.

    (10 a.m. ET) U.S. pending home sales for June.

    Earnings include: Abbott Laboratories; GE Aerospace; Netflix Inc.; Seagate Technology PLC; Taiwan Semiconductor Manufacturing; UnitedHealth Group Inc.


    Friday July 17

    Euro zone CPI

    (8:30 a.m. ET) Canada’s international securities transactions for May.

    (8:30 a.m. ET) U.S. housing starts for June. Consensus is an annualized rate jump of 13.0 per cent.

    (8:30 a.m. ET) U.S. building permits for June. The Street expects a decline of 0.7 per cent on an annualized rate basis.

    (8:30 a.m. ET) U.S. import prices for June. Consensus is a decline of 0.6 per cent from May but a rise of 6.2 per cent year-over-year.

    (9:15 a.m. ET) U.S. industrial production and capacity utilization for June.

    (10 a.m. ET) U.S. University of Michigan Consumer Sentiment for July.

    Earnings include: Travelers Companies Inc.

  • Information Tech Capped Index ($TTTK):

    Summary

    • The S&P/TSX Capped Information Technology Index (TTTK) gained approximately 3.2% over the latest 10 trading sessions, using the closely tracking XIT ETF as the observable proxy: C$72.16 on June 26 to C$74.46 on July 10.
    • Shopify was the principal positive contributor, rising 4.7% over the period. Its large index weight—approximately 28%—gave the move substantial influence.
    • CGI gained 3.9%, adding moderate support because it represents roughly 9% of the sector index.
    • Kinaxis was effectively unchanged, rising only 0.05%, and its approximately 2% index weight meant its contribution was negligible.
    • TTTK’s rise was not broad and uniform. It was largely a large-cap technology rally, particularly Shopify, while daily volatility remained high.

    10-Trading-Day Performance

    The period measured is June 26 through July 10, 2026.

    SecurityJune 26 closeJuly 10 closeChange
    TTTK proxy—XITC$72.16C$74.46+3.19%
    SHOP.TOC$165.70C$173.51+4.71%
    GIB.A.TOC$91.29C$94.85+3.90%
    KXS.TOC$154.74C$154.81+0.05%

    Price data:

    TTTK Movement

    TTTK moved through three phases.

    1. June 26–30: uneven start

    The XIT proxy rose strongly on June 26, fell slightly on June 29 and recovered on June 30:

    DateXIT daily move
    June 26+1.08%
    June 29−0.17%
    June 30+0.78%

    Shopify gained 4.62% on June 26, but then fell 2.04% on June 29, creating volatility at the index level. CGI also rose 3.3% on June 26, while Kinaxis gained 3.4%.

    2. July 2–7: upward momentum

    XIT advanced in each session from July 2 through July 7:

    • July 2: +0.51%
    • July 3: +0.42%
    • July 6: +0.34%
    • July 7: +0.99%

    The largest support came from Shopify, which gained 4.55% on July 2 and another 1.46% on July 7. CGI also rose 2.69% on July 2 and 1.52% on July 7.

    3. July 8–10: volatility but positive finish

    TTTK weakened on July 8 as Shopify, CGI and Kinaxis all declined:

    StockJuly 8 move
    SHOP−2.60%
    GIB.A−1.89%
    KXS−2.91%

    XIT declined 0.88% that day. The broader TSX was also pressured by renewed U.S.–Iran tensions and risk reduction across Canadian equities.

    Technology rebounded over July 9–10, with XIT adding 0.67% and 0.49%, respectively.

    SHOP.TO

    Performance

    Shopify rose from C$165.70 to C$173.51, a gain of:173.51165.70165.70×100=4.71%\frac{173.51-165.70}{165.70}\times100=4.71\%165.70173.51−165.70​×100=4.71%

    The stock traded in a wide range, reaching an intraday high of C$184.96 on July 10, before closing at C$173.51.

    Key drivers

    1. Analyst upgrades

    Shopify received supportive analyst commentary during the period, including a Stifel upgrade to Buy and a reinstated Buy rating from Bank of America. These calls strengthened sentiment after the stock’s earlier earnings-related decline.

    2. Recovery from the May earnings sell-off

    Shopify had fallen sharply after its first-quarter results despite revenue growing 34% year over year to US$3.17 billion. Investors had been disappointed by profitability and guidance that did not exceed elevated expectations. The recent advance represents, in part, a recovery from that earlier valuation compression.

    3. Upcoming earnings catalyst

    Shopify announced that it would report second-quarter 2026 results. Ahead of earnings, the market is focusing on:

    • revenue growth in the high-20% range;
    • free-cash-flow margin;
    • merchant-solutions growth;
    • AI-commerce adoption;
    • operating expense discipline.

    The share price remains sensitive because Shopify trades at a high growth-oriented valuation.

    4. July 9 rally

    Shopify rose 3.41% on July 9, materially lifting TTTK. The gain coincided with positive analyst activity.

    Assessment

    Shopify was the main driver of TTTK’s 10-day gain. At approximately 28% of the index, a 4.7% Shopify gain would, in isolation, contribute roughly:28%×4.7%1.3%28\%\times4.7\%\approx1.3\%28%×4.7%≈1.3%

    to the sector index before accounting for rebalancing and other holdings.

    GIB.A.TO — CGI

    Performance

    CGI rose from C$91.29 to C$94.85, a gain of 3.9%.

    Key drivers

    1. Recovery from earlier weakness

    CGI had fallen as low as approximately C$86–C$88 in mid-to-late June. The latest period therefore represented a recovery from oversold conditions rather than a major earnings-driven revaluation.

    2. Contract and partnership announcements

    Positive operational announcements included:

    • CGI’s participation in launching Massachusetts’ Mosaic financial-management system;
    • recognition as a Microsoft cloud and AI delivery partner;
    • continued government and enterprise technology contract activity.

    These announcements reinforced CGI’s recurring-revenue and public-sector contract profile.

    3. Valuation support

    CGI is generally less volatile than Shopify because its business is based more heavily on long-duration IT services, outsourcing and government contracts. Its lower-growth but more predictable cash-flow profile attracted buyers following the prior decline.

    4. Continuing caution

    The recovery occurred after Scotiabank had lowered its price target to C$95 from C$110 in late June. This suggests the market still has concerns about organic growth, contract timing or margin expansion.

    Assessment

    CGI provided a meaningful secondary contribution to TTTK. Based on an approximately 8.9% weight, its 3.9% gain contributed roughly:8.9%×3.9%0.35%8.9\%\times3.9\%\approx0.35\%8.9%×3.9%≈0.35%

    to the index.

    KXS.TO — Kinaxis

    Performance

    Kinaxis moved from C$154.74 to C$154.81, essentially unchanged at +0.05%.

    The flat result concealed substantial volatility:

    • July 2: +3.43%
    • July 6: −1.48%
    • July 7: +2.06%
    • July 8: −2.91%
    • July 10: +1.16%

    Key drivers

    1. Positive customer announcements

    Kinaxis announced that MANE had selected its supply-chain planning platform, following other recent partnership and customer-expansion announcements. These wins supported confidence in recurring SaaS demand.

    2. Strong underlying growth

    Kinaxis’ first-quarter SaaS revenue grew 21% year over year, annual recurring revenue grew 20%, and adjusted EBITDA margin increased to 32%. These results provide fundamental support.

    3. Valuation and execution sensitivity

    Despite strong operating growth, Kinaxis remains sensitive to:

    • contract timing;
    • SaaS bookings;
    • foreign-exchange movements;
    • implementation delays;
    • changes in technology-sector valuation multiples.

    The stock therefore failed to hold its early-period gains.

    4. Limited index impact

    Kinaxis represents only about 2.1% of XIT/TTTK. Its flat 10-day return had virtually no effect on the sector index.

    Contribution Summary

    Using approximate July index weights:

    CompanyApprox. index weight10-day returnApprox. contribution
    Shopify28.1%+4.71%+1.32 percentage points
    CGI8.9%+3.90%+0.35 percentage points
    Kinaxis2.1%+0.05%~0.00 percentage points

    The remaining gain came mainly from other large holdings, particularly Celestica and Constellation Software, which together account for nearly half of the index. Approximate holdings data show Shopify, Celestica and Constellation Software dominate TTTK/XIT, making the index substantially more concentrated than the broad TSX.

    Risks

    • Shopify earnings or guidance below high market expectations.
    • Higher bond yields compressing technology valuation multiples.
    • AI-related disruption to traditional software and IT-service models.
    • CGI organic-growth weakness or slower contract awards.
    • Kinaxis bookings volatility and longer implementation cycles.
    • Concentration risk: roughly three-quarters of the index is held in Shopify, Celestica and Constellation Software.

    Scenarios

    ScenarioTTTK interpretation
    BullShopify sustains momentum, CGI continues its recovery and other large holdings remain firm; TTTK breaks above the recent trading range.
    BaseTTTK consolidates after the 3.2% advance while investors await Shopify and CGI earnings.
    BearShopify reverses, bond yields rise or earnings guidance disappoints; concentration causes TTTK to decline disproportionately.

    Actionable Takeaways

    • TTTK’s latest increase was primarily Shopify-driven, supported by CGI and other large index constituents.
    • SHOP.TO: strongest of the three, but also the most valuation-sensitive and volatile.
    • GIB.A.TO: recovering from depressed levels; steadier business profile, but organic-growth concerns remain.
    • KXS.TO: fundamentally solid but price performance was neutral; customer wins have not yet produced sustained upward momentum.
    • The bullish interpretation would be disproved by Shopify falling back below its late-June range, CGI failing to hold approximately C$90–C$92, or Kinaxis breaking materially below C$150.
  • Loblaw Co (L.TO):

    Summary

    • Loblaw (L.TO) closed at C$64.18 on July 10, 2026, compared with C$65.93 on June 26.
    • Over the latest 10 trading sessions, the shares declined C$1.75, or 2.7%.
    • The stock initially fell to C$61.69 on July 6, a 6.4% decline from June 26, before recovering strongly during July 7–10.
    • There was no major negative company announcement during the period. The decline appears primarily attributable to profit-taking, consumer-staples sector rotation and uncertainty before second-quarter earnings.
    • The late-period recovery indicates that investors continued to view Loblaw as a relatively defensive business supported by discount grocery demand, earnings growth and share repurchases.

    10-Trading-Day Performance

    DateClosing priceDaily change
    June 26C$65.93−0.24%
    June 29C$64.59−2.03%
    June 30C$64.34−0.39%
    July 2C$62.87−2.28%
    July 3C$62.45−0.67%
    July 6C$61.69−1.22%
    July 7C$63.04+2.19%
    July 8C$63.92+1.40%
    July 9C$63.39−0.83%
    July 10C$64.18+1.25%

    Net movement: C$65.93 → C$64.18
    10-session return: −2.7%
    Low during period: C$61.05 intraday on July 6.

    Key Drivers

    1. Profit-taking after the June advance

    Loblaw had risen from approximately C$63.38 on June 22 to C$66.20 on June 24, a gain of roughly 4.5% in two sessions. That rally left the stock vulnerable to short-term profit-taking.

    The June 29–July 6 decline therefore partially reversed the preceding advance rather than representing a clear deterioration in Loblaw’s business.

    2. Rotation away from defensive consumer staples

    Loblaw is normally treated as a defensive stock because grocery and pharmacy demand is relatively stable.

    During periods when investors become more comfortable with economic or market conditions, capital can rotate toward:

    • technology;
    • financials;
    • industrials;
    • other economically sensitive sectors.

    That rotation can temporarily pressure grocery shares even when the company’s underlying earnings outlook has not changed.

    3. Uncertainty ahead of second-quarter earnings

    On July 2, Loblaw announced that it would release its second-quarter 2026 results on July 30. As earnings approach, investors tend to reassess:

    • food same-store sales;
    • Shoppers Drug Mart performance;
    • gross margins;
    • operating expenses;
    • consumer trade-down toward discount banners;
    • management’s full-year earnings guidance.

    The July 2 announcement was not negative, but it may have focused attention on execution risks following Loblaw’s earlier revenue shortfall.

    4. Mixed first-quarter fundamentals remained an overhang

    Loblaw’s first-quarter revenue increased approximately 4% year over year to C$14.48 billion, but was below the C$14.55 billion analyst consensus cited by Reuters.

    Key operating results were mixed:

    Q1 2026 metricResult
    RevenueC$14.48 billion
    Revenue growthApproximately 4% YoY
    Food same-store sales+2.4%
    Drug retail same-store sales+4.1%
    Adjusted EPSC$0.52
    Full-year outlookHigh-single-digit adjusted earnings growth

    Discount banners such as No Frills and Maxi continued to outperform, but cautious consumer spending and pressure on non-essential purchases remained concerns.

    5. Share repurchases provided underlying support

    Loblaw has authorization to repurchase up to approximately 58.1 million shares, equal to about 5% of outstanding shares, between May 8, 2026 and May 7, 2027.

    Share repurchases reduce the public share count and can support earnings per share, although the actual price impact depends on the timing and size of purchases.

    Price Pattern

    The period had two distinct phases:

    June 29–July 6: decline

    The stock fell from C$65.93 to C$61.69, a drop of:61.6965.9365.93×100=6.4%\frac{61.69-65.93}{65.93}\times100=-6.4\%65.9361.69−65.93​×100=−6.4%

    The selling was relatively persistent, suggesting profit-taking and sector rotation rather than a one-day reaction to a specific company announcement.

    July 7–10: recovery

    The stock then recovered from C$61.69 to C$64.18:64.1861.6961.69×100=+4.0%\frac{64.18-61.69}{61.69}\times100=+4.0\%61.6964.18−61.69​×100=+4.0%

    The rebound suggests that buyers returned near C$61–C$62, likely attracted by Loblaw’s defensive earnings profile and upcoming share-repurchase support.

    Valuation Logic

    Loblaw’s valuation depends primarily on whether it can continue growing earnings faster than revenue through:

    • expansion of discount stores;
    • private-label sales;
    • pharmacy and healthcare services;
    • expense control;
    • share repurchases;
    • supply-chain productivity.

    The principal valuation constraint is that grocery sales growth is relatively mature. Sustained multiple expansion requires continued margin improvement or stronger-than-expected earnings growth, rather than revenue growth alone.

    Risks

    • Another quarterly revenue miss.
    • Lower food inflation reducing nominal sales growth.
    • Weak discretionary and front-store sales at Shoppers Drug Mart.
    • Higher labour, distribution and store-expansion costs.
    • Regulatory or political pressure on grocery pricing and margins.
    • Increased competition from Walmart, Costco, Metro and Empire.
    • Heavy capital spending reducing free cash flow available for repurchases.

    Scenarios

    ScenarioPossible interpretation
    BullL.TO holds above C$63–C$64 and retests the C$66–C$67 area as Q2 earnings confirm high-single-digit EPS growth.
    BaseShares remain between approximately C$61 and C$66 while investors wait for the July 30 earnings release.
    BearA weak Q2 revenue or margin result pushes the stock below C$61, potentially reopening the C$58–C$60 range.

    Actionable Takeaways

    • The 2.7% 10-session decline was moderate, but concealed a sharper 6.4% mid-period drawdown and subsequent recovery.
    • The movement was mainly a valuation and positioning adjustment, not a confirmed fundamental breakdown.
    • C$61–C$62 emerged as the immediate support zone.
    • C$65.50–C$66.50 remains the near-term resistance area.
    • The next significant company-specific catalyst is the July 30, 2026 second-quarter earnings release.
    • The positive thesis would be weakened by falling same-store sales, margin compression or a reduction in full-year earnings guidance.
  • Alimentation Couche-Tard Inc (ATD.TO)

    Summary

    • ATD.TO closed at C$91.19 on July 10, 2026, down C$2.24 or 2.4% over the latest 10 trading sessions, measured from the June 26 close of C$93.43.
    • The period was primarily a consolidation after the post-earnings surge. ATD had jumped 11.7% on June 23 after stronger-than-expected fiscal Q4 results.
    • The stock traded as high as approximately C$93.63 on July 8 but failed to retest its recent 52-week high of C$95.15.
    • The 2.9% decline on July 9 was partly affected by the stock trading ex-dividend, although the C$0.215 dividend represented only about 0.23% of the share price; most of the decline reflected selling and profit-taking.
    • Overall assessment: modest pullback, not a reversal of the earnings-driven improvement.

    10-Trading-Day Performance

    DateClosing priceDaily change
    June 26C$93.43−0.15%
    June 29C$91.50−2.07%
    June 30C$90.40−1.20%
    July 2C$90.27−0.14%
    July 3C$91.38+1.23%
    July 6C$90.97−0.45%
    July 7C$91.81+0.92%
    July 8C$93.15+1.46%
    July 9C$90.49−2.86%
    July 10C$91.19+0.77%

    Net change: C$93.43 → C$91.19
    Price return: −2.4%
    Including the C$0.215 dividend: approximately −2.2% total return.

    Key Drivers

    1. Profit-taking after strong earnings

    ATD’s fiscal Q4 adjusted EPS increased 58.7% year over year to US$0.73, while adjusted EBITDA rose 30.9%. The gains were driven by:

    • stronger road-fuel margins;
    • organic convenience-store growth;
    • acquisitions;
    • favourable foreign-currency translation.

    The earnings release drove the stock from C$82.26 on June 22 to C$91.87 on June 23. The subsequent 10-day decline therefore appears mainly to be investors taking profits following an unusually large one-day revaluation.

    2. Resistance near C$94–C$95

    ATD reached a 52-week high of C$95.15 on June 24. During the latest period, rallies toward C$93–C$94 attracted sellers.

    This suggests the market had already priced in much of the earnings improvement, at least over the short term.

    3. July 9 ex-dividend adjustment

    ATD traded ex-dividend on July 9 for its C$0.215 quarterly dividend. In theory, this reduces the share price by roughly the dividend amount when the stock begins trading without entitlement to the payment.

    However:

    • dividend impact: approximately C$0.215, or 0.23%;
    • actual July 9 decline: C$2.66, or 2.86%.

    Therefore, the dividend explains only a small part of the decline. The remainder likely represented profit-taking and rejection near technical resistance.

    Fundamental Context

    Q4 fiscal 2026 metricResultYoY change
    Adjusted EPSUS$0.73+58.7%
    Adjusted net earningsUS$667M+51.2%
    Gross profitUS$3.5B+19.4%
    Adjusted EBITDANot separately stated here+30.9%
    Fiscal-year adjusted EPSUS$3.10+14.4%

    The operating results remain supportive. The main caution is that part of the Q4 improvement came from elevated fuel margins, which can fluctuate materially between quarters. Operating expenses and financing costs also increased.

    Scenarios

    ScenarioShort-term interpretation
    BullATD holds C$90–C$91 and breaks above C$95.15 as investors continue upgrading earnings expectations.
    BaseStock consolidates between approximately C$89 and C$95 while the market waits for evidence that stronger fuel margins and merchandise growth are sustainable.
    BearA break below C$89 would indicate that the earnings rally is being unwound, potentially exposing the C$86–C$88 area.

    Actionable Takeaways

    • The latest decline was mainly consolidation and profit-taking, rather than evidence of a new company-specific deterioration.
    • C$90–C$91 is the immediate support area; C$94–C$95.15 is the principal resistance zone.
    • The next fundamental test is whether ATD can maintain improved fuel margins and convenience-store sales without excessive expense growth.
    • The positive thesis would be weakened by declining U.S. merchandise sales, normalization of fuel margins, rising leverage or a sustained break below the post-earnings trading range.
  • Consumer Staples Index ($TTCS)

    TTCD.TO tracks the S&P/TSX Capped Consumer Discretionary Index, a benchmark for Canadian consumer discretionary stocks (e.g., retailers, auto parts, hotels, and leisure companies like Magna, Linamar, Canadian Tire components, etc.). It is not a single company stock but a sector index.

    Recent Performance (Past ~10 Trading Days, late June–July 10, 2026):

    The index has been relatively flat to slightly down, showing mild consolidation after earlier strength. Exact daily closes are less granular than individual stocks, but sector peers (MG.TO, LNR.TO, CTC.A.TO) suggest:

    • Early July weakness/pullback from June highs.
    • Modest recovery in some sessions, but overall limited net movement (likely -1% to +1% range over 10 days, depending on exact window).
    • Influenced by broader market sentiment, with mixed results across discretionary names (some resilience in value retailers, softness in cyclical auto/industrial exposure).

    Key Drivers/Context:

    • Sector Rotation & Macro Factors: Consumer discretionary is cyclical and sensitive to interest rates, consumer confidence, and economic growth expectations. Recent moves may reflect profit-taking, rotation into other sectors, or caution ahead of earnings season.
    • Component Influence: Heavy weights in companies like those in auto parts (e.g., MG.TO, LNR.TO) and retail (e.g., CTC.A influences) have seen mixed results—some rebounds but overall sector caution.
    • Broader Market: The TSX has been stable, but discretionary sectors can lag or lead depending on risk appetite. No major negative sector-wide news, but individual company volatility (e.g., post-earnings adjustments) contributes.
  • Dollarama Inc (DOL.TO)

    DOL.TO (Dollarama Inc.) has declined modestly over the past 10 trading days (late June to July 10, 2026), giving back some of the gains from a strong mid-June rally.

    Recent Price Action (Closing Prices):

    • Jul 10: Closed at 185.25 (+1.06%; ex-dividend adjustment noted)
    • Jul 9: Closed at 183.43
    • Jul 8: Closed at 186.25
    • Jul 7: Closed at 185.86
    • Jul 6: Closed at 186.16
    • Jul 3: Closed at 188.11
    • Jul 2: Closed at 186.57
    • Jun 30: Closed at 187.62
    • Jun 29: Closed at 191.22
    • Jun 26: Closed at 193.93 (recent high area)

    Net over ~10 days: From around 193–194 (late June) to ~185 on Jul 10, a decline of roughly 4–5% (including the ex-dividend impact on Jul 10 of $0.12 per share). The stock has pulled back from near-term highs but remains well above its 52-week low (~166).

    Possible Reasons for the Decline:

    1. Profit-Taking After Rally: Dollarama shares surged in mid-June (e.g., strong move on/after June 11 earnings). The Q1 results beat expectations with solid same-store sales growth driven by cost-conscious consumers, boosting the stock ~7% initially. Markets often see pullbacks as investors lock in gains.
    2. Ex-Dividend Adjustment: The stock went ex-dividend on July 10 ($0.12 quarterly). This typically causes a price drop roughly equal to the dividend amount (all else equal), contributing to the recent move.
    3. Broader Market/Sector Dynamics: As a high-valuation growth retailer (trailing P/E ~38), DOL can be sensitive to interest rate expectations, consumer spending trends, or rotation out of defensive/consumer staples names. No major negative company-specific news appears to be driving this—recent updates include a normal course issuer bid renewal.
    4. Technical Consolidation: After hitting resistance near 195–200+, the stock is consolidating. Volume has been reasonable but not extreme on down days.

    Overall Context: This appears to be a healthy pause rather than a fundamental reversal. Dollarama continues to benefit from its dollar-store model in a value-seeking environment, with strong long-term growth (store expansion, private label, etc.). Longer-term performance remains solid despite the recent softness.

  • July 10/26: Canadian Stocks Edge Higher Amid Easing Middle East Tensions, June Jobs Data Release

    Canadian stocks inched higher on Friday, extending the gains from yesterday’s session, as regional mediators are frantically working to bring the U.S. and Iran back for re-negotiations following their recent standoff while June month jobs data showed an unexpected increase.

    After opening a little higher than yesterday’s close, today the benchmark S&P/TSX Composite Index remained volatile initially but later traded firmly positive throughout the rest of the session before settling at 35,305.31, up by 104.86 points (or 0.30%).

    Five of the 11 sectors posted gains today, with the consumer discretionary sector leading the pack.

    Today in Canada, data from Statistics Canada revealed that the unemployment rate eased to 6.50% in June from 6.60% in the previous month, below market expectations that it would remain unchanged and tying for the lowest since July 2024.

    Net employment rose by 18,000 positions in June to 21,139,700, supported by part-time positions. Unemployment fell by 13,200 to 1,469,200.

    In contrast, manufacturing employment fell by 17,000, reversing much of May’s 15,000 increase.

    The Bank of Canada is set to announce its next interest rate decision on July 15. Economists are of the view that the central bank will likely hold its overnight rate at 2.25% as inflation rose to 3.20% in the month of May.

    On July 1, the U.S. administration refused to extend the Canada-United States-Mexico Agreement for free trade in its current form until 20236. Instead, the U.S. opted for a 10-year extension with mandatory annual reviews.

    The U.S. decision has put Canadian businesses in trouble as they cannot make any long-term plans. Further, an annual review could entitle the U.S. to tweak the agreement in its favor.

    Canadian exporters utilized the CUSMA deal to send their goods to the U.S. circumventing the high tariffs imposed by U.S. President Donald Trump last year.

    Though product-specific aggressive U.S. tariffs hurt the economy, nearly 90% of U.S. imports from Canada remained duty-free with CUSMA serving as a backstop. As losing this protection could rattle the economy, investors are awaiting how the government handles the situation.

    In the recent months, Canada’s Prime Minister Mark Carney set out for various countries in Asia, the Middle East and Europe to explore marketplaces outside the U.S.

    Yesterday, Carney signed multiple memoranda of understanding with Saudi Arabia, covering several industries including mining, energy, artificial intelligence, etc.

    The U.S. and Iran signed a Memorandum of Understanding on June 17. However, both nations engaged in exchange of fire on July 7 and 8.

    Today, via Truth Social, Trump stated that Iran asked the U.S. to continue with the negotiations and added that the U.S. has agreed to it.

    Axios reported that officials from Qatar, Pakistan, Turkey, Egypt, and Saudi Arabia conducted multiple phone calls on Wednesday and Thursday with the U.S. as well as Iranian officials, and cited a diplomat as stating that both sides want to come back to the MoU.

    Reuters reported that a Qatari team is in Iran to facilitate the next round of negotiations between the U.S.

    The Joint Maritime Information Center issued an advisory to mariners indicating the threat level across the Strait of Hormuz as “severe” and urged sailors to remain vigilant.

    Major sectors that gained in today’s trading were Consumer Discretionary (1.50%), Consumer Staples (1.23%), Financials 0.94(%), IT (0.59%), and Energy (0.10%).

    Among the individual stocks, Aritzia Inc (7.43%), Trekor Metals Limited (4.04%), Gildan Activewear Inc (2.95%), Metro Inc (2.27%), Empire Company Limited (1.91%), and Igm Financial Inc (3.41%) were the prominent gainers.

    Major sectors that lost in today’s trading were Utilities (0.04%), Industrials (0.12%), Healthcare (0.17%), Real Estate (0.36%), Materials (0.56%), and Communication Services (0.65%).

    Among the individual stocks, Quebecor Inc (3.12%), Lithium Americas Corp (7.11%), Americas Gold and Silver Corporation (3.81%), Colliers International Group Inc (1.49%), Bausch Health Companies Inc (1.60%), and Mda Space Ltd (4.06%) were the notable losers.

  • High fees and underperforming funds? When it’s OK to fire your financial advisor

    Working with a financial advisor comes at a cost, but it can be hard to measure the quality of what you are getting, and keep track of how much you are paying for it.

    For people who don’t scrutinize their statements, this can mean giving up a lot of money to both high fees and poor performance.

    I recently did a portfolio review for a couple who works with a financial advisor from one of the big investment management companies. As I dug into the details of their investments, my blood started to boil. Their portfolio was full of high-fee mutual funds, and their returns were well below the market’s.

    One fund their financial advisor had them invested in was the Mackenzie Bluewater Canadian Growth Balanced Fund. This fund charges a 2.3-per-cent fee – called a management expense ratio (MER) – and gave investors a return of 5.84 per cent a year over the past 10 years.

    By comparison, an exchange-traded fund with a similar asset allocation – the iShares Balanced ETF Portfolio (XBAL), which tracks stock and bond indexes – returned 7.95 per cent a year over the past 10 years. A $10,000 investment in the Mackenzie fund over 10 years would have grown to $17,811, but the ETF portfolio would have been worth $21,689, or $3,878 more.

    How to know when to change financial advisors

    This advisor had other underperforming high-fee mutual funds in their portfolio and this is simply unacceptable.

    Advisors like this should be fired by their clients. And investors, don’t fret if you fear your portfolio looks like this. There are other options.

    The most cost-effective choice is to move to do-it-yourself investing using index-tracking ETFs, where you will pay fees in the range of 0.1 to 0.2 per cent. Another cost-effective method is to use a robo-advisor, a kind of managed investing, with fees in the range of 0.4 to 0.8 per cent.

    These options aren’t for everyone, and some people need or want to work with a financial advisor. But there are still ways to keep those costs in check.

    The first step is to understand how you pay your advisor. There are two main models. The first is commission-based, where you don’t pay the advisor directly but they receive compensation from mutual fund companies.

    This is commonly through a trailing commission, a payment the advisor receives as long as you stay invested in a mutual fund. The fees are quite high – about 2 to 2.5 per cent– which lower your returns from the fund.

    The second compensation arrangement is a fee-based model. A fee-based advisor will charge you a percentage of the money they manage on your behalf. This fee is often around 1 per cent and you will see it come out of your account monthly or quarterly. You will still pay the MER on any funds that you own, but those fees will be lower than the funds that a commission-based advisor will sell you.

    This fee-based model can have lower overall costs than the commission-based model. A fee-based advisor can offer you less-expensive mutual funds, called F-series funds, or fee-based funds, which don’t pay a trailing commission.

    The advisor can also invest your money in index mutual funds, which have substantially lower fees than the more commonly used actively managed funds because they don’t pay trailing commissions. Some advisors can also invest in ETFs, many of which will have even lower fees than index mutual funds. A fee-based advisor should put these options on the table. If they don’t, ask for them.

    Not only will you pay lower fees with index mutual funds and ETFs, but these funds do better than actively managed funds 98 per cent of the time, according to S&P Global, a capital markets company.

    Before you begin working with a fee-based advisor, make it clear that you want your fees to be low. Ask them to present you with an investment proposal that uses low-cost funds, and to explain in writing what your total fee will be.

    This disclosure is important because it can be hard for investors to see all of the fees they pay. Although advisors have to send you an annual report that discloses their fees, these reports usually leave out the part about the MERs on the mutual funds you own, so you’re not getting the full picture.

    Starting in 2027, this disclosure will improve: The Canadian Investment Regulatory Organization will require the report to show how much you are paying on your funds, based on the MER. If you don’t want to wait that long, find the MER for each of your funds by looking online at the fund’s profile, and calculate your total annual fees yourself by multiplying the MER by the amount you have invested.

    If your fees shock you, consider that a wake-up call. Push your advisor to explain why your fees are so high, or say goodbye.