Laurentian Bank of Canada reported a net loss of $20.5 million in its first quarter as it was hit by costs related to its shift to become a specialty commercial bank and exit its retail and small and medium business banking business.
The Montreal-based bank announced a plan in December that will see its commercial operations go to Fairstone Bank of Canada in a $1.9-billion deal while National Bank will acquire the retail and small business segment for roughly book value.
Under the terms, the more than 175-year-old Laurentian Bank name will live on as part of Fairstone with the head office of the commercial segment to remain in Montreal.
Laurentian said Friday its loss amounted to 58 cents per diluted share for the quarter ended Jan. 31 compared with a profit of $38.6 million or 76 cents per share a year earlier.
Revenue totalled $251.6 million, up from $249.6 million in the same quarter last year.
On an adjusted basis, Laurentian says it earned 65 cents per diluted share in its latest quarter, down from an adjusted profit of 78 cents per diluted share a year earlier.
This report by The Canadian Press was first published Feb. 27, 2026.
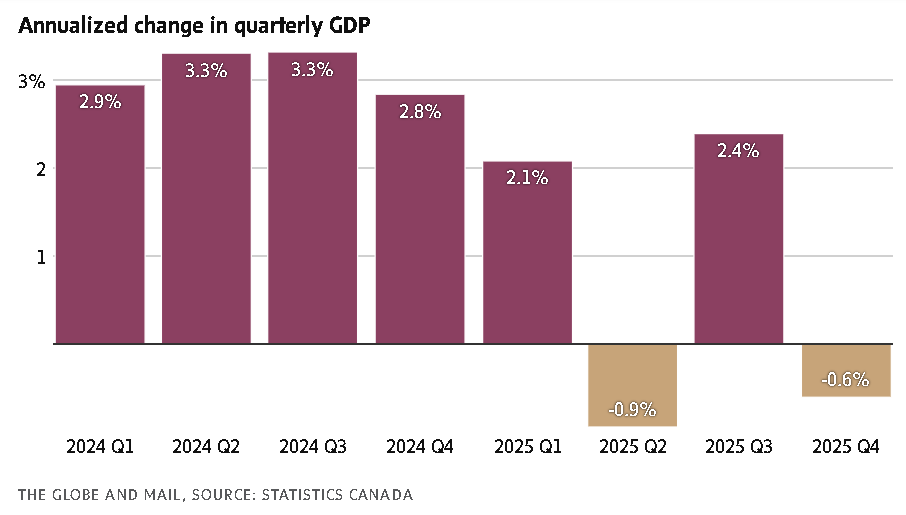
Statistics Canada says the economy capped off a volatile year with a contraction in the final quarter of 2025.
The agency said Friday that real gross domestic product declined 0.6 per cent on an annualized basis in the fourth quarter, falling short of expectations from the Bank of Canada and most economists for flat growth. Real GDP per capita was unchanged in the fourth quarter.
Statscan said the main reason for the contraction was businesses drawing down their inventories – in other words, selling off goods or materials that weren’t reproduced in the quarter.
BMO chief economist Doug Porter said in a note to clients Friday that, outside the inventory decline, the details for the fourth quarter GDP figures were better than the headline suggested.
A rise in household spending and increased government capital spending – particularly on weapons systems – also gave the economy a lift in the fourth quarter. Business investment, meanwhile, declined thanks to weakness in residential activity.
The economy swung back and forth between gains and losses every quarter last year as sharp changes in exports tied to U.S. tariffs drove volatility in GDP data.
The economy also shrank in the second quarter as tariffs took full effect in the economy, but Statscan also revised that decline to 0.9 per cent from previous estimates of a steeper 1.8 per cent contraction.
The agency said real GDP rose 1.7 per cent in 2025 overall, cooling from 2-per-cent growth in each of the previous two years and marking the slowest pace of annual growth since 2016 outside the COVID-19 pandemic.
“Lower exports, particularly to the United States, were the main contributor to the slower rise in GDP in 2025,” Statscan said in its report.
The agency said exports rose in consecutive quarters to close 2025 but shipments to the United States did not fully recover after the sharp second quarter drop.
Statscan said real GDP was up 0.2 per cent in December as the manufacturing sector rebounded to partially offset two straight months of declines. Wholesale trade also grew for the first time in three months while the mining, quarrying and oil and gas extraction sectors saw activity drop.
The agency’s advance estimates suggest real GDP was flat in January. Initial readings suggest the momentum in manufacturing was short-lived and the industry contracted to start the year.
Michael Davenport, senior Canada economist at Oxford Economics, said in a note that Friday’s data release showed economy started 2026 on “shaky footing.” He is expecting the economy will skirt a recession with modest growth in the first quarter.
“Still, soft economic momentum will persist in the near term, due to US tariffs, elevated trade policy uncertainty, and a shrinking population. This will keep recession risks elevated,” Davenport said.
The Bank of Canada said in updated forecasts last month that it expects growth to rebound to 1.8 per cent annualized in the first quarter of the year. The central bank held its policy rate steady at 2.25 per cent at its January.
Porter said those projections “could be a stretch” given the weight of ongoing U.S. tariff uncertainty on the economy.
“Until that uncertainty clears, the economy will likely continue to struggle,” he said.
Porter said mild growth expectations for 2026 keep alive the possibility of additional interest rate cuts from the Bank of Canada, “but we’re not quite there yet.”
About TRC TRC stands for adaptability. With direction setting perspectives and partnerships, our ~8,000 tested practitioners in advisory, consulting, construction, engineering and management services deliver unique resolutions that answer any built or natural imperative. By creating new pathways for the world to thrive, we help our clients adapt to change and achieve long-lasting results while solving the challenges of making the Earth a better place to live — community by community and project by project. TRC is ranked #17 on ENR’s list of the Top 500 Design Firms, #5 for Power and #3 for Transmission & Distribution. Learn more at TRCcompanies.com
About WSP WSP is one of the world’s leading professional services firms, uniting its engineering, advisory and science-based expertise to shape communities to advance humanity. From local beginnings to a globe-spanning presence today, WSP operates in over 50 countries and employs approximately 83,000 professionals, known as Visioneers. Together they pioneer solutions and deliver innovative projects in the transportation, infrastructure, environment, building, energy, water, and mining and metals sectors. WSP is publicly listed on the Toronto Stock Exchange (TSX:WSP).
MONTREAL, Feb. 24, 2026 (GLOBE NEWSWIRE) — WSP Global Inc. (TSX: WSP) (“WSP” or the “Corporation”), one of the world’s leading professional services firms, proudly completes its previously announced acquisition of TRC Companies (“TRC”), a premier U.S. Power & Energy brand delivering end-to-end solutions that support the full infrastructure lifecycle (the “Acquisition”). With more than 55 years of history, TRC and its team of approximately 8,000 professionals have established the company as a leader and trusted strategic advisor in the engineering and consulting industry.
Fully aligned with WSP’s 2025-2027 Global Strategic Action Plan, the Acquisition supercharges the Corporation’s Power & Energy offering and enhances its capabilities across high-growth areas, including water, infrastructure, environment, and digital solutions. With TRC, WSP creates the #1 Power & Energy platform in the U.S.1 and becomes the country’s largest engineering and design firm by revenue2.
“Today, we officially welcome TRC to WSP. This Acquisition strengthens our leading position in the U.S. and broadens our capabilities across the Power & Energy value chain at a time of accelerating demand for reliable and resilient energy systems. By combining advisory, engineering, and program management expertise, we are creating a more integrated platform to support complex infrastructure programs from planning through execution. TRC brings deep sector knowledge and strong client relationships that enhance the reach and impact of our diversified platform. Together, we are better positioned to pursue opportunities in high-growth areas and deliver more comprehensive solutions to our clients. I look forward to working with our new colleagues as we integrate the two businesses with care and execute with discipline,” commented Alexandre L’Heureux, President and Chief Executive Officer of WSP.
Also commenting on the Acquisition, Christopher P. Vincze, Chairman and Chief Executive Officer of TRC, said: “This milestone marks an exciting new chapter for TRC as we join WSP. Since the 1960s, our teams have delivered trusted expertise, underscored by continued innovation and an advanced use of digital, to help clients navigate critical challenges with confidence. Joining WSP allows us to build on this legacy at greater scale—increasing opportunities for our people, expanding the capabilities we can offer our clients, and accelerating our ability to shape more resilient infrastructure. We are proud of the work that brought us here, energized by what we can achieve together, and committed to ensuring a smooth and thoughtful integration for our employees and clients.”
Loblaw Cos. Ltd. reported its fourth-quarter profit and revenue rose compared with a year earlier.
The parent company of Loblaws and Shoppers Drug Mart says it earned a profit available to common shareholders of $656 million or 55 cents per diluted share for the 13-week period ended Jan. 3.
The profit was up from $462 million or 38 cents per diluted share for its fourth quarter of 2024 which included 12 weeks.
Revenue for the quarter totalled $16.38 billion, up from $14.73 billion, helped by the extra week. On a 12-week comparable basis, Loblaw said revenue rose 3.5 per cent.
Food retail same-store sales increased by 1.5 per cent, while drug retail same-store sales rose 3.9 per cent, with pharmacy and health-care services same-store sales growth of 5.6 per cent and 2.2 per cent in front store same-store sales growth.
On an adjusted basis, Loblaw says it earned 67 cents per diluted share in its latest quarter, up from 55 cents per diluted share a year earlier.
This report by The Canadian Press was first published Feb. 25, 202
National Bank of Canada reported a first-quarter profit of $1.25 billion, up from $997 million a year earlier, helped by its acquisition of Canadian Western Bank.
The bank says the profit amounted to $3.08 per diluted share for the quarter ended Jan. 31, up from $2.78 in the first quarter of 2025.
Revenue totalled $3.89 billion, up from $3.18 billion a year earlier.
National Bank’s provision for credit losses amounted to $244 million for the quarter, down from $254 million a year earlier.
On an adjusted basis, National Bank says it earned $3.25 per diluted share in its latest quarter, up from an adjusted profit of $2.93 a year earlier.
Analysts on average had expected an adjusted profit of $2.99 per share, according to LSEG Data & Analytics.
This report by The Canadian Press was first published Feb. 25, 2026.
BMO Financial Group reported a first-quarter profit of $2.49 billion, up from $2.14 billion a year earlier.
The bank says its profit amounted to $3.39 per diluted share for the quarter ended Jan. 31, up from $2.83 per diluted share in the same quarter last year.
Revenue for the quarter totalled $9.82 billion, up from $9.27 billion a year earlier.
The bank’s provisions for credit losses for the quarter amounted to $746 million, down from $1.01 billion.
On an adjusted basis, BMO says it earned $3.48 per diluted share in its latest quarter, up from an adjusted profit of $3.04 per diluted share a year earlier.
Analysts on average had expected an adjusted profit of $3.20 per share in the quarter, according to LSEG Data & Analytics.
This report by The Canadian Press was first published Feb. 25, 2026.
The Bank of Nova Scotia reported $2.30 billion in first-quarter net income, up from $993 million a year earlier.
The bank says the profit amounted to $1.73 per diluted share for the quarter ended Jan. 31, up from 66 cents per diluted share in the same period a year earlier.
Revenue totalled $9.65 billion, up from $9.37 billion.
Scotiabank says its provision for credit losses was $1.18 billion for the quarter, up from $1.16 billion a year earlier.
On an adjusted basis, Scotiabank says it earned $2.05 per diluted share in its latest quarter, up from $1.76 a year earlier.
The average analyst estimate had been for an adjusted profit of $1.95 per share, according to LSEG Data & Analytics.
This report by The Canadian Press was first published Feb. 24, 2026.
International Business Machines stock is getting slammed, becoming the latest victim of rapidly developing AI technology, after Anthropic’s Claude announced COBOL capabilities.
Shares of IBM fell 11% in Monday afternoon trading after Anthropic outlined a new use case for its Claude Code product: automating the exploration and analysis work that drives most of the complexity in COBOL modernization.
COBOL, short for Common Business-Oriented Language, is a decades-old programming language used widely in business data processing, which is a core business area for IBM. COBOL continues to power systems responsible for large volumes of transactions, including payment processing and retail transaction systems, making it a prime target for cost-efficient AI disruption.
In a Monday blog post, Anthropic wrote that COBOL handles an estimated 95% of ATM transactions in the U.S., for example.
“Hundreds of billions of lines of COBOL run in production every day, powering critical systems in finance, airlines, and government. Despite that, the number of people who understand it shrinks every year,” the Anthropic blog post reads. “AI excels at streamlining the tasks that once made COBOL modernization cost-prohibitive.”
It then explained that Claude Code can help modernize COBOL codebases by mapping dependencies across thousands of lines of code, documenting workflows and identifying risks that “would take human analysts months to surface.”
“Legacy code modernization stalled for years because understanding legacy code cost more than rewriting it. AI flips that equation,” the blog post says.
IBM is the latest stock to fall on AI fears, which have rattled investors in recent weeks and contributed to a volatile “sell first and ask questions later” trading environment. On Friday, a slew of cybersecurity companies tumbled after Anthropic unveiled a new capability it built into Claude Code, called Claude Code Security, that it said is capable of scanning codebases for security vulnerabilities and finding software vulnerabilities for humans to review. The sector remained under pressure in Monday’s session.
Monday’s sell-off brought IBM shares down nearly 22% year to date.
Canada’s biggest banks are set to post higher profits as elevated trading activity boosted by volatile equity markets is expected to curb the impact of softening loan demand from consumers and businesses.
Analysts broadly expect profits to rise in the mid-single-digit percentage points in the first quarter as the lenders continue to shrug off concerns over the U.S. trade war.
“Notwithstanding the still-unresolved tariff-related uncertainties, the Canadian banks’ business diversification (which resulted in mid-teens percentage earnings growth last year) has benefited their shareholders,” BMO analyst Sohrab Movahedi said in a recent note.
The first quarter “is unlikely to be a major inflection point. As we await resolution around tariffs, we expect a continuation of last year’s earnings drivers.”
On Tuesday, Bank of Nova Scotia BNS-T -1.65%decrease will be the first major bank to report earnings for the three months ended Jan. 31. Bank of Montreal BMO-T -2.63%decrease and National Bank of Canada NA-T -0.02%decrease will report results on Wednesday. Royal Bank of Canada RY-T -1.37%decrease, Toronto-Dominion Bank TD-T -1.54%decrease and Canadian Imperial Bank of Commerce CM-T -0.94%decrease will wrap up earnings week on Thursday.
Canadian bank stocks have edged higher by 4.2 per cent this year, trailing the S&P TSX Composite Index’s 6.5 per cent climb.
Clients continue to turn to the banks’ capital-markets and wealth-management businesses for trading and advisory services to grab a piece of whipsawing equity markets. Analysts expect this elevated activity to offset dampened borrowing in personal and business banking.
Based on regulatory data for the first month of the quarter, loans grew modestly, Bank of Nova Scotia analyst Mike Rizvanovic said in a note to clients.
“We remain positive on the large Canadian banks heading into Q1 earnings season that we suspect will once again feature strong results in market-sensitive businesses, upside to all-bank margins that will help keep [net interest income] growing despite only modest loan volumes, and credit losses remaining in a very manageable range in the absence of any signs of meaningful deterioration in the economic outlook,” Mr. Rizvanovic said.
Analysts expect provisions for credit losses – the money banks set aside to cover sour loans – to edge higher slightly, easing from their stark upward trajectory in recent years amid concerns over an economic downturn. The provisions are a closely watched measure of financial stress among customers.
Canada’s unemployment rate improved in January, suggesting that Canadian consumers and businesses will continue to withstand economic shocks. But credit card trust data – an indicator of consumer credit strength – pointed to rising delinquencies, according to CIBC analyst Paul Holden.
Overall, the banks have ample provisions to weather an economic downturn, and Mr. Holden said there is room for reserves to be released in the U.S. as regional banks recently set aside fewer provisions than expected. Lenders unwind reserves when confidence increases in the ability of consumers and businesses to pay off their loans. The release of built-up reserves also bolsters the banks’ profits.
“In Canada, however, given the still-uncertain macro backdrop, we believe it is still too early to see releases,” Mr. Holden said.
“The banks have updated their forecasts for 2026 unemployment and GDP growth, which have improved from last quarter. This would typically indicate the possibility to release performing provisions, but we believe it is still too early given heightened uncertainty in the outlook.”