Canada’s main stock index higher on Friday, supported by firmer gold prices after a weaker-than-expected U.S. jobs data tempered bets for a near-term Federal Reserve interest rate hike.
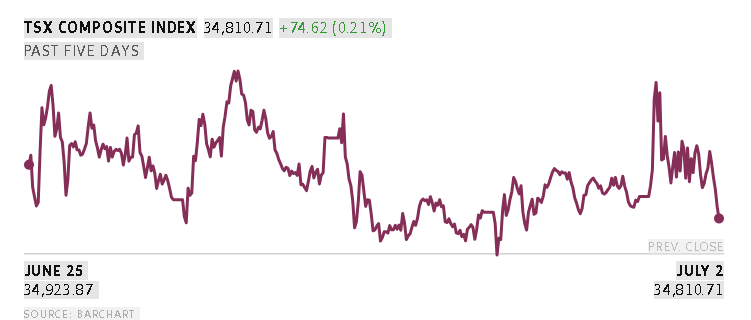
At 9:47 a.m. ET, the S&P/TSX composited index was up 291.01 points, or 0.83 per cent, at 35,257.68.
Global stocks also extended gains on Friday after a lukewarm U.S. jobs report softened expectations for an imminent rate hike from the Federal Reserve and regional activity gauges pointed to an economic expansion during June.
Europe’s broadest index hit a record high and was set for its biggest weekly gain in over a month.
The pan-European STOXX 600 reached 651.77 before settling to a steadied 650.29. Germany’s DAX index rose 0.4 per cent, the French index steadied and the UK dipped 0.2 per cent.
MSCI’s broadest index of world shares rose 0.4 per cent.
“Europe’s Stoxx 600 ended the week with a bang as investors lapped up utilities, industrials and basic materials stocks,” Dan Coatsworth, at investment platform AJ Bell, said in a note.
“While these movements imply a more upbeat investor, it’s important to keep watching the U.S. tech stocks, as many are coming off the boil,” he added.
South Korea’s Kospi swung between gains and losses before closing around 6 per cent higher, as buyers pounced on battered chipmaker stocks.
Purchasing Managers’ Index (PMI) data released on Friday indicated increased activity across Asia.
Japan’s services sector returned to expansion in June after stalling the previous month. China’s services activity expanded at a slightly slower pace, but overseas demand rose at the fastest rate in 20 months.
“The PMIs remain healthy by recent standards and still imply stronger economic momentum across Q2 as a whole,” analysts from Capital Economics said of the Chinese data.
U.S. job growth slowed sharply in June and payroll gains for the prior two months were revised lower, according to data released on Thursday, pointing to a cooling labour market.
The tepid jobs data doused traders’ expectations of an imminent rate hike and raised the chances that the Fed will keep rates on hold until October.
Fed funds futures are pricing an implied 46.8 per cent probability that the U.S. central bank will keep rates steady at its meeting on September 15 to 16, compared to a 35.8 per cent chance a day earlier, according to the CME Group’s FedWatch tool.
Inflation remained a concern.
“Our biggest anticipated risk this year, even before the Iran war, was shipping,” said James Rossiter, head of global economics at TD Securities.
“Ships have been rerouted all over the world because of the Hormuz Strait closure, leading to less shipping capacity globally,” he told Reuters in a phone call, suggesting the price effects of this were still working their way through the global economy.
U.S. futures remained buoyant, with S&P 500 and Nasdaq futures up 0.3 per cent and 1.1 per cent respectively. The U.S. market is closed on Friday to celebrate Independence Day.
Against the yen, the U.S. dollar held steady around 161, with the greenback having given up earlier gains as market liquidity was thinned by the holiday and traders remained on watch for intervention.
The Japanese currency has been choppy this week after Reuters reported on Thursday authorities may have adopted a new approach to their forays into the market.
The U.S. dollar index, which measures the greenback’s strength against a basket of six currencies, was down 0.2 per cent at 100.76.
In commodities, Brent crude futures steadied at US$71.75. Gold was up just over 1.3 per cent at US$4,178.
In cryptocurrencies, bitcoin ticked up 0.1 per cent to US$62,090.78.
Reuters