https://www.facebook.com/watch/?v=2537604700000084
https://www.facebook.com/watch/?v=2537604700000084

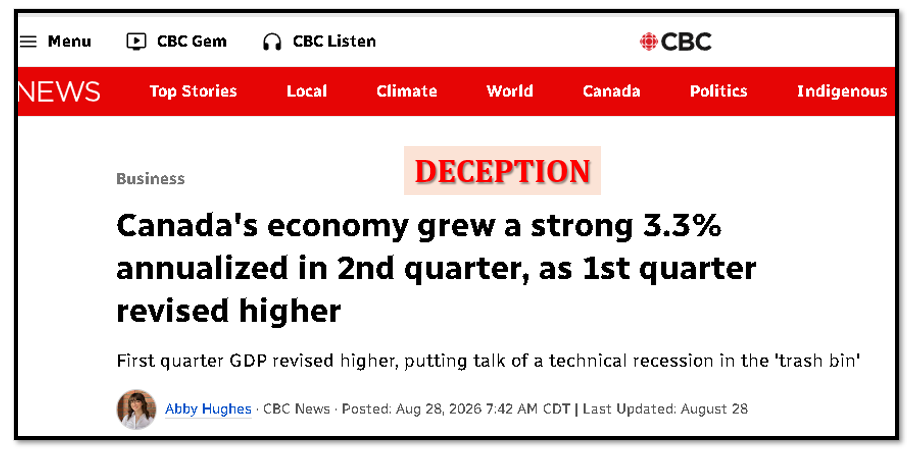
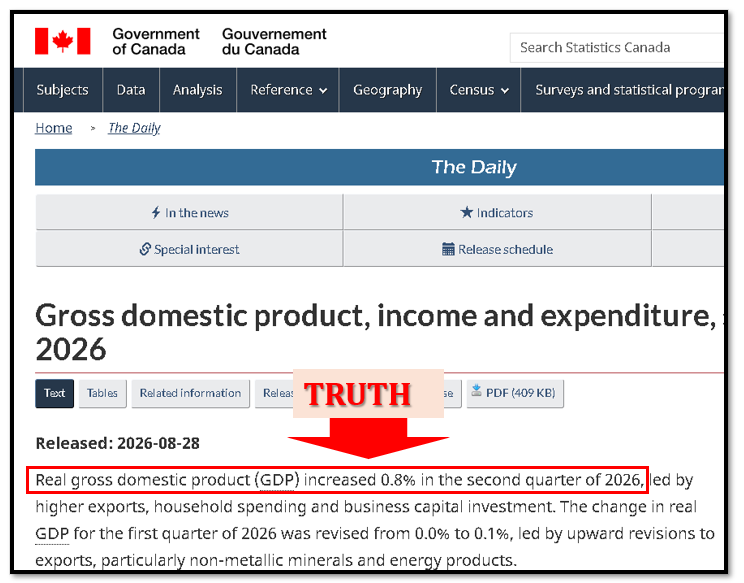
DO NOT TRUST CANADA’S LIBERAL MEDIA!
It is not about POLITICS…Its about PROTECTING your hard EARNED savings!
| Date | Event | Why it matters for the TSX |
|---|---|---|
| Sept. 1 | U.S. ISM Manufacturing and JOLTS job openings | Tests industrial activity, inflation pressure and labour demand |
| Sept. 2 | U.S. ADP employment | Early—but imperfect—signal for Friday’s payroll report |
| Sept. 2 | Bank of Canada rate decision, 9:45 a.m. ET | Direct impact on CAD, banks, REITs, utilities and indebted consumers |
| Sept. 3 | U.S. ISM Services | Important for inflation because services prices and wages remain persistent |
| Sept. 4 | Canada Labour Force Survey, 8:30 a.m. ET | Changes expectations for the next BoC decision |
| Sept. 4 | U.S. nonfarm payrolls, 8:30 a.m. ET | Key driver of U.S. yields, the dollar, gold and technology valuations |
Official schedules: Bank of Canada, Statistics Canada and U.S. Bureau of Labor Statistics.
This is the week’s most important Canadian event.
Likely initial effects:
Likely initial effects:
| Sector | Representative names |
|---|---|
| Banks | RY, TD, BMO, BNS, CM, NA |
| REITs | CAR.UN, BEI.UN, REI.UN, CHP.UN |
| Utilities | FTS, EMA, CU |
| Telecom | BCE, T, RCI.B |
| Rate-sensitive consumer | CTC.A, ATZ, DOO |
Both employment reports are released simultaneously, increasing the probability of a sharp CAD/USD move.
A weak Canadian report combined with strong U.S. payrolls would be the most negative combination for the Canadian dollar. A strong Canadian report could reduce expectations of further BoC easing.
Key components:
A strong headline accompanied by high prices would be inflationary and potentially negative for bonds, gold and technology valuations.
A strong report with easing prices would be more constructive for industrial and technology shares.
Services prices are especially important because they are heavily influenced by wages. Persistent services inflation would reinforce Federal Reserve Chair Kevin Warsh’s hawkish Jackson Hole message.
Iran’s Revolutionary Guards stated that Iran has “full control” over the Strait and that current restrictions will remain until U.S. military actions end. Reuters
Watch for:
| Development | Likely sector effect |
|---|---|
| Shipping disruption | Positive for WTI and Canadian energy |
| De-escalation | Negative for oil’s geopolitical premium |
| Higher tanker costs | Negative for transportation and refiners |
| Oil-driven inflation | Negative for REITs, utilities and consumer shares |
Most sensitive names: CNQ, SU, IMO, CVE, MEG, TOU and ARX. Pipelines such as ENB and TRP would likely be less sensitive than oil producers.
Ukraine has intensified attacks on Russian refineries. Russia extended its diesel-export ban through September 30 after refinery outages and domestic shortages. Reuters
Potential effects:
The effect on crude oil is mixed: refinery outages can reduce Russian demand for crude while export restrictions tighten refined-product supply.
Canada’s retaliatory tariffs take effect September 8, immediately after the Labour Day weekend. Markets will position during the week ending September 4.
The tariffs cover approximately 700 U.S. products, with rates of 15%, 25% and 50%. Categories include steel, aluminum, clothing, prepared foods, appliances, tools, electronics and furniture. Reuters
The key market question is whether exemptions, remission procedures or renewed negotiations emerge before September 8.
The core OPEC+ producers meet on September 6, just outside the requested week. Traders will begin positioning before Friday’s close.
OPEC+ previously approved an approximately 188,000-barrel-per-day increase for September. The market will focus on whether the group:
| Scenario | Main developments | Likely TSX impact |
|---|---|---|
| Bull | Dovish BoC; balanced jobs data; Hormuz remains operational; tariff exemptions emerge | Broader participation led by financials, REITs, utilities and technology |
| Base | BoC holds; mixed employment; tariff uncertainty continues; oil remains volatile | Range-bound TSX with rapid sector rotation |
| Bear | Hawkish BoC/Fed signals; weak Canadian jobs; Hormuz disruption; tariff escalation | Consumer, auto and rate-sensitive sectors weaken; energy may outperform |
The priority order for the week is:
The main cross-market signals are CAD/USD, Canadian and U.S. two-year yields, WTI, gold and tariff-sensitive auto suppliers.
Educational analysis only. Scheduled events can change, and geopolitical developments are inherently unpredictable.
Monday August 31
China’s PMI
Japan’s retail sales and industrial production
Germany CPI and retail sales
U.K. markets closed
Tuesday September 1
Japan’s capital spending and manufacturing PMI
Euro zone CPI, manufacturing PMI and jobless rate
(9:30 a.m. ET) Canada’s S&P Global Manufacturing PMI for August.
(9:45 a.m. ET) U.S. S&P Global Manufacturing PMI for August.
(10 a.m. ET) U.S. construction spending for July.
(10 a.m. ET) U.S. ISM Manufacturing for August.
(10 a.m. ET) U.S. Job Openings & Labor Turnover Survey for July.
Also: Canadian and U.S. auto sales for August.
Earnings include: Alimentation Couche-Tard Inc.; Dell Technologies Inc.; Medtronic PLC; Palo Alto Networks Inc.
Wednesday September 2
Japan’s consumer confidence
(8:15 a.m. ET) U.S. ADP National Employment Report for August.
(9:45 a.m. ET) Bank of Canada’s rate decision with Governor Tiff Macklem’s press conference to follow.
(10 a.m. ET) U.S. factory orders for July.
(2 p.m. ET) U.S. Beige Book is released.
Earnings include: Broadcom Inc.; Hewlett Packard Enterprise Co.; Major Drilling Group International Inc.; Rockpoint Gas Storage Inc.; Snowflake Inc.
Thursday September 3
Japan’s and Euro zone’s services and composite PMI
(8:30 a.m. ET) Canada’s international merchandise trade for July.
(8:30 a.m. ET) Canadian labour productivity for Q2.
(8:30 a.m. ET) U.S. initial jobless claims for week of Aug. 29.
(8:30 a.m. ET) U.S. productivity for Q2. The Street is expecting an annualized rate rise of 1.4 per cent.
(8:30 a.m. ET) U.S. goods and services trade deficit for July.
(8:30 a.m. ET) U.S. Revelio Public Labor Statistics for August.
(9:30 a.m. ET) Canada’s S&P Global Services PMI for August.
(9:45 a.m. ET) U.S. S&P Global Services and Compsoite PMI for August.
(10 a.m. ET) U.S. ISM Services PMI for August.
Earnings include: BRP Inc.; Ciena Corp.; Enghouse Systems Ltd.; Lululemon Athletica Inc.; VersaBank; Zscaler Inc.
Friday September 4
Japan’s household spending
Germany’s factory orders
Euro zone’s retail sales
(8:30 a.m. ET) Canadian employment for August. The Street is expecting an increase of 17,500 jobs with the unemployment rate remaining 6.4 per cent.
(8:30 a.m. ET) U.S. nonfarm payrolls for August. Consensus is a gain of 58,000 jobs with the unemployment rate remaining 4.1 per cent and average hourly wages gaining 3.1 per cent year-over-year.
(10 a.m. ET) Canada’s Ivey PMI for August.
(10 a.m. ET) U.S. Global Supply Chain Pressure Index for August.
President Donald Trump on Friday said the U.S. has entered an agreement with Venezuela to take control of 65 billion barrels of the South American country’s oil reserves.
Trump in a social media post announced the agreement he said was negotiated by Secretary of State Marco Rubio, Defense Secretary Pete Hegseth and Venezuela’s interim President Delcy Rodriguez.
“The United States of America has just entered into an Agreement with the Country of Venezuela on, THE BIGGEST OIL DEAL IN WORLD HISTORY!” Trump wrote.
The Venezuelan government’s press office did not immediately respond to a request for comment.
The announcement of the deal comes nearly nine months after the U.S. military at Trump’s direction carried out an operation to capture Venezuela’s president Nicolás Maduro and spirit him to the United States to face federal narcoterrorism and drug trafficking charges.
Trump faces mounting pressure to address high gas prices as the war in Iran on Friday reached a six-month milestone with no conclusion in sight. The U.S. has tapped its strategic petroleum reserves, which in early August fell below 300 million barrels, down by more than 100 million barrels since the start of 2026.
The U.S.-Israel war against Iran has led to a dramatic slowdown of Gulf oil moving through the Strait of Hormuz, which about 20 per cent of the world petroleum passed through prior to the conflict.
The average price of gas in the U.S. stood at about US$4.09 a gallon on Friday, according to AAA. The average price was US$3.21 at the same time last year.
Trump in his social media post Friday evening alluded to the Venezuela deal being part of a private partnership. The White House did not immediately reply to a request for comment about the private sector partners involved in the deal, and details on how the arrangement would work were not provided.
Persuading big American oil companies to return the region could face headwinds given and decades of badly damaged infrastructure.
Days after the ouster of Maduro, Trump gathered oil executives at the White House and called on them to rush back into Venezuela. Executives expressed interest in the opportunity but there was also a measure of caution given their past experience in the country.
Darren Woods, CEO of ExxonMobil, the largest U.S. oil company, said at that moment he saw the country as “un-investable.”
But Trump has insisted that his administration has brought a measure of stability to Venezuela.
He has argued that Venezuela stole U.S. oil when former Venezuelan President Hugo Chavez’s moved decades ago to nationalize hundreds of foreign-owned assets, including those owned by American oil companies.
Rodriguez, in one of her early moves after taking power, signed a law that opens the nation’s oil sector to privatization and reversed a bedrock tenet of the self-proclaimed socialist movement that had ruled the country for more than two decades.
Rubio said on X that the agreement would usher in US$100-billion in private investment into Venezuela and lead to lower gas prices in the United States.
“This deal is a huge win for both the American and Venezuelan people,” Rubio posted.
Venezuela has one of the largest oil reserves in the world, with an estimated 303 billion barrels of crude oil in the ground. That’s about 17 per cent of the world’s supply, according to the U.S. Energy Information Administration. Unlike other parts of the world, where geologists have to search for untapped oil, the reserves under Venezuela’s soil are largely mapped and known, experts say. But because of dilapidated infrastructure, the country only produces about 1 per cent of the world’s oil.
| Measure | Approximate result |
|---|---|
| Monday spot-gold close | US$4,639/oz |
| Monday intraday high | US$4,681/oz |
| Friday late spot price | Approximately US$4,470/oz |
| September futures settlement | US$4,478.10/oz |
| Five-day decline | Approximately 3.0%–3.3% |
Different gold benchmarks—spot, LBMA fixing and COMEX futures—close at different times, explaining the small variation.
Warsh said the Fed still had “more work to do” unless inflation was clearly moving toward its 2% target. Markets increased the probability of a September rate increase to approximately 62%. Reuters
Higher interest rates hurt gold because gold pays no interest. When Treasury yields rise, holding bonds becomes relatively more attractive.
Short-term U.S. yields rose after Warsh’s speech. This increased the opportunity cost of owning gold and triggered selling in precious metals.
The U.S. dollar rose as investors anticipated higher U.S. rates. Because gold is priced in U.S. dollars, a stronger dollar makes gold more expensive for buyers using other currencies and commonly pressures demand.
Gold reached its highest level since May on Monday. The rally had been supported by:
Once the Fed outlook changed, traders locked in gains after three consecutive positive weeks.
Trade tensions and geopolitical risks continued to support gold fundamentally. However, during this five-day period, the interest-rate and dollar effects outweighed safe-haven demand.
The Canadian dollar weakened to approximately C$1.39 per US$1. A weaker Canadian dollar cushioned the decline for Canadian gold holders because:
Therefore, gold’s percentage decline in Canadian dollars was likely smaller than its roughly 3.2% U.S.-dollar decline. The exact result depends on the exchange-rate fixing used.
| Scenario | Key development | Possible gold response |
|---|---|---|
| Bull | Softer inflation or renewed geopolitical escalation | Recovery toward US$4,600–US$4,680 |
| Base | Rate uncertainty persists | Consolidation around US$4,400–US$4,550 |
| Bear | September rate increase becomes highly probable; dollar strengthens further | Decline toward US$4,250–US$4,400 |
These are analytical ranges, not forecasts or price targets.
The gold decline was primarily a monetary-policy correction, not the disappearance of geopolitical or fiscal risks. Near-term direction will depend on U.S. inflation, Treasury yields, the dollar and the probability of a September Fed rate increase.
Educational analysis only; no guarantee of future performance.
| Security | Aug. 21 close | Aug. 28 close | C$ change | Five-day move |
|---|---|---|---|---|
| XIT—TTTK proxy | C$76.18 | C$78.34 | +C$2.16 | +2.84% |
| Shopify | C$205.63 | C$212.42 | +C$6.79 | +3.30% |
| Kinaxis | C$179.75 | C$178.68 | −C$1.07 | −0.60% |
| CGI | C$103.14 | C$103.85 | +C$0.71 | +0.69% |
Price data: XIT, SHOP, KXS and GIB.A.
Data gap: Complete daily TTTK index data were not consistently available through the public feed. XIT seeks to replicate the index and is used as the closest investable proxy.
| Date | XIT | SHOP | KXS | GIB.A |
|---|---|---|---|---|
| Aug. 24 | +0.47% | +0.97% | +0.24% | +0.34% |
| Aug. 25 | +1.23% | +2.51% | −2.60% | −0.56% |
| Aug. 26 | −0.59% | −2.04% | −2.06% | −1.32% |
| Aug. 27 | +2.67% | +2.48% | +3.17% | +1.65% |
| Aug. 28 | −0.94% | −0.59% | +0.76% | +0.60% |
XIT’s approximate August 26 weights were:
| Company | Approximate weight |
|---|---|
| Shopify | 26.1% |
| Constellation Software | 25.3% |
| Celestica | 23.0% |
| CGI | 9.4% |
| Kinaxis | 2.4% |
Three companies—Shopify, Constellation Software and Celestica—represented roughly three-quarters of the index. Therefore, TTTK’s gain cannot be explained solely by the four companies requested.
Key index drivers were:
1. Strong Q2 momentum remained supportive
Shopify’s Q2 revenue rose 34% YoY to US$3.58 billion, while gross merchandise volume reached approximately US$115.6 billion. The company also provided an upbeat third-quarter outlook. These results continued to support investor expectations for strong e-commerce and merchant-services growth.
2. Positive analyst sentiment
Positive analyst commentary on Shopify’s sales momentum, AI-commerce capabilities and operating leverage supported the shares early in the week.
3. High volatility after the earnings rally
Shopify had already risen sharply after its August 5 results. Consequently, daily movements were large:
The pattern indicates changing risk appetite and profit-taking rather than a fundamental reversal.
4. Currency effect
SHOP.TO reflects both Shopify’s U.S.-listed share price and the CAD/USD exchange rate. A weaker Canadian dollar can raise the Toronto-listed price even when the U.S. share price is unchanged.
1. Early-week profit-taking
Kinaxis fell 2.6% Tuesday and 2.1% Wednesday after reaching approximately C$180. The magnitude of the decline was greater than the broader technology sector’s movement, indicating company-specific profit-taking or valuation sensitivity.
2. New customer announcement was not financially quantified
On August 25, Kinaxis announced that Ansaldo Energia selected its platform for global supply-chain planning. The contract supports demand for Kinaxis’s software, but no contract value or revenue contribution was disclosed. Kinaxis announcement list
Without financial details, the announcement was insufficient to prevent the initial decline.
3. RBC support drove a recovery
RBC maintained an Outperform rating and a C$210 target on August 26. The shares subsequently recovered:
The rebound reduced the weekly decline from approximately 4.4% at Wednesday’s close to only 0.6% by Friday.
1. Stable operating model
CGI’s government and large-enterprise contracts provide recurring revenue and relatively stable cash flow. This helped limit its five-day volatility compared with Shopify and Kinaxis.
2. AI debate remains unresolved
Investors continue to hold two opposing views:
The resulting uncertainty explains why CGI has traded at a lower valuation than higher-growth software companies.
3. Late-week recovery
CGI fell 1.3% Wednesday but recovered 1.7% Thursday and 0.6% Friday. No material company announcement fully explains the reversal; it appears primarily related to broader technology-sector buying and valuation support.
| Scenario | TTTK/XIT | SHOP | KXS | GIB.A |
|---|---|---|---|---|
| Bull | C$80–C$82 | C$218–C$225 | C$185–C$192 | C$107–C$111 |
| Base | C$76–C$80 | C$203–C$218 | C$171–C$185 | C$100–C$107 |
| Bear | Below C$76 | Below C$203 | Below C$171 | Below C$100 |
These are analytical ranges, not price targets.
TTTK’s five-day gain was concentrated in its largest holdings. Shopify strengthened the index, Kinaxis finished slightly lower despite a late rebound, and CGI was broadly stable. The major risk is concentration: Shopify, Constellation Software and Celestica collectively determine most of the index’s direction.
XIT is the iShares S&P/TSX Capped Information Technology Index ETF. It trades on the TSX in Canadian dollars and seeks to track the S&P/TSX Capped Information Technology Index (TTTK).
Educational analysis only; no guarantee of future performance.
| Date | Close | Daily move | Main interpretation |
|---|---|---|---|
| Aug. 21 | C$97.28 | Starting price | — |
| Aug. 24 | C$98.83 | +1.59% | Defensive buying following trade escalation |
| Aug. 25 | C$98.34 | −0.50% | Partial profit-taking and tariff uncertainty |
| Aug. 26 | C$98.54 | +0.20% | Stable grocery and real-estate exposure |
| Aug. 27 | C$97.70 | −0.85% | Consumer-staples selling and sector rotation |
| Aug. 28 | C$98.20 | +0.51% | Recovery as broader markets weakened |
| Five-session change | +C$0.92 | +0.95% |
George Weston is principally a holding company with exposure to:
Both businesses are relatively defensive. Consumers continue buying food and prescriptions during economic uncertainty, while Choice Properties receives contractual rental income from a tenant base heavily anchored by Loblaw.
That defensive profile supported WN when trade tensions increased on August 24.
Loblaw finished the five-day period almost unchanged at −0.18%. Its stable performance limited downside for George Weston.
Loblaw’s underlying support came from:
However, Canadian retaliatory tariffs could raise the cost of selected foods, toiletries and household goods. This prevented a stronger rally.
Choice Properties gives WN a second earnings stream outside grocery retail. Its properties are generally supported by long-term leases and necessity-based tenants.
This diversification likely helped WN outperform Loblaw slightly. However, the exact five-day contribution cannot be isolated from public closing-price data because WN’s daily movement also reflects its holding-company discount and internal share transactions.
George Weston’s most recent results showed:
| Q2 2026 measure | Result | YoY change |
|---|---|---|
| Revenue | C$15.20 billion | +4.1% |
| Adjusted EBITDA | C$1.94 billion | +6.1% |
| Adjusted net earnings | C$436 million | +9.8% |
| Adjusted diluted EPS | C$1.14 | +12.9% |
| Reported net earnings | C$133 million | −48.4% |
The reported earnings decline was mainly caused by non-cash fair-value adjustments related to Choice Properties, not weaker underlying operations. The market appears to have focused more heavily on adjusted earnings.
George Weston repurchased and cancelled 3.1 million shares for C$300 million during Q2. Fewer outstanding shares contributed approximately C$0.03 to adjusted EPS growth.
Buybacks do not guarantee a rising share price, but they can support per-share earnings and reduce available share supply.
WN’s value is largely determined by:
The shares may trade below the estimated value of these holdings because investors apply a holding-company discount for structural complexity, taxes and corporate expenses.
WN’s five-day outperformance suggests investors valued its combination of grocery, pharmacy and real-estate exposure during heightened uncertainty.
| Scenario | Development | Indicative range |
|---|---|---|
| Bull | Loblaw margins remain stable and bond yields ease | C$100–C$104 |
| Base | Stable grocery earnings with continued tariff uncertainty | C$96–C$101 |
| Bear | Food-cost pressure combines with higher property yields | C$91–C$96 |
These are analytical ranges, not price targets.
WN.TO’s five-day gain reflected its defensive combination of grocery, pharmacy and real estate, rather than a new company announcement. The principal items to track are Loblaw’s retail margins, tariff-related food costs, Choice Properties’ operating results and Canadian bond yields.
Educational analysis only; no guarantee of future performance.
| Date | Close | Daily move | Main interpretation |
|---|---|---|---|
| Aug. 21 | C$60.53 | Starting price | — |
| Aug. 24 | C$61.56 | +1.70% | Defensive buying after trade escalation |
| Aug. 25 | C$61.25 | −0.50% | Partial profit-taking |
| Aug. 26 | C$61.45 | +0.33% | Grocery and pharmacy stability |
| Aug. 27 | C$60.61 | −1.37% | Consumer-staples selling and reversal of Monday’s gain |
| Aug. 28 | C$60.42 | −0.31% | Broader market weakness |
| Five-session change | −C$0.11 | −0.18% | Essentially flat |
The U.S.–Canada trade dispute escalated on August 24. Investors initially moved toward companies selling essential products rather than autos, discretionary merchandise or industrial goods.
Loblaw benefits from relatively stable demand across:
This explains why Loblaw rose 1.7% on Monday while tariff-exposed manufacturers declined sharply.
Canada subsequently announced retaliatory tariffs on approximately 700 U.S. products, including prepared foods, cheese, seafood, toiletries and other consumer goods.
Potential negatives for Loblaw include:
Potential positives include:
These opposing effects help explain why Loblaw finished the week approximately flat.
Loblaw fell 1.37% on August 27, its largest daily decline of the week. Public news searches did not identify a material earnings release, guidance change or corporate announcement that would explain the move.
The most likely explanation is a combination of:
This is an inference from market behaviour, not a confirmed company-specific catalyst.
Loblaw’s July 30 results remained constructive:
| Q2 2026 measure | Result | YoY change |
|---|---|---|
| Revenue | C$15.27 billion | +4.1% |
| Adjusted EBITDA | Approximately C$1.9 billion | +5.1% |
| Adjusted diluted EPS | C$0.66 | +11.9% |
| Adjusted EBITDA margin | 12.6% | +10 basis points |
| 2026 adjusted EPS outlook | High-single-digit growth | Reaffirmed |
These results reduced the likelihood of a major sell-off because they showed stable demand and continued earnings growth.
Q2 was Loblaw’s final quarter consolidating PC Financial. Beginning in Q3, Loblaw will instead recognize its proportionate share of EQB’s earnings.
This change could make year-over-year revenue and earnings comparisons less straightforward. However, it was already disclosed before the five-day period and was not a new catalyst last week.
Loblaw’s valuation reflects:
The limitation is that defensive quality is already partly reflected in the price. Without a new earnings catalyst, the shares may remain range-bound when investors rotate toward faster-growing or commodity-sensitive sectors.
| Scenario | Development | Indicative range |
|---|---|---|
| Bull | Tariff impact remains limited; discount and private-label demand strengthens | C$62–C$64 |
| Base | Stable sales with modest food-cost pressure | C$59.50–C$62 |
| Bear | Tariffs raise costs while political pressure limits price increases | C$56–C$59 |
These are analytical ranges, not price targets.
Loblaw’s five-day performance was stable rather than meaningfully negative. Defensive grocery and pharmacy demand offset tariff-cost uncertainty and sector rotation. The next important evidence will be food inflation, comparable sales, retail margins and the first quarterly report following the PC Financial transaction.
Educational analysis only; no guarantee of future performance.