Canada won’t rule out imposing retaliatory tariffs on the United States if the White House moves ahead with a new wave of trade actions, Prime Minister Mark Carney said Thursday, even as he made avoiding the punitive measures his main goal.
At the close of a three-day meeting of the country’s premiers in Charlottetown, Mr. Carney said at a press conference that his priority with the United States is an exhaustive trade deal that leaves no Canadian sector out in the cold.
The government is “in pursuit of a comprehensive agreement that addresses all tariff-related sectors,” the Prime Minister said.
“Everything’s on the table if there’s no agreement.”
He declined to share any details about what retaliation Ottawa is considering. Mr. Carney also suggested Canada has had the chance to sign partial deals but has forgone that option with the aim of getting a trade pact that addresses all the tariffs targeting Canadian industries, from steel to aluminum to autos.
Opinion: Premiers, tear down these internal trade walls
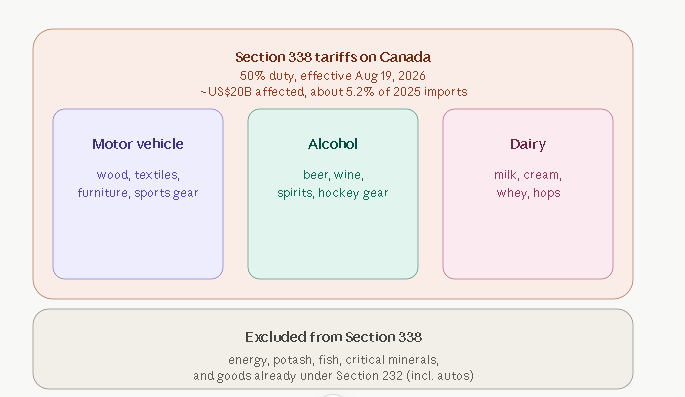
On Monday, U.S. President Donald Trump announced that his administration would impose a 50-per-cent tariff on a wide range of Canadian goods beginning Aug. 19. At his Thursday press conference, Mr. Carney said the move from the White House was both a pressure tactic and an opportunity to wrap negotiations that have dragged on for well over a year.
“We’ve seen a series of trade negotiations that the U.S. has undertaken, and normally there’s a deadline, normally there’s an outsized tariff associated with that deadline,” Mr. Carney said.
He cautioned that he was not giving any indication as to whether he thought the talks with the U.S. would have a positive or negative outcome. In French, he said that while there is the possibility of retaliation, on the flip side there is the option for co-operation that serves the interests of both countries.
“We don’t need to respond in advance. In fact, I think it would be counterproductive at this stage to respond in advance,” Mr. Carney said.
Meanwhile, the Trump administration on Thursday said it would move forward with another tariff of between 10 to 12.5 per cent on dozens of countries in its latest attempt to maintain a baseline levy on most of the U.S.’s trading partners.
The tariff, which would amount to 10 per cent for Canada, replaces a temporary tariff imposed in February, which itself replaced the “Liberation Day” tariff announced last year under the International Emergency Economic Powers Act (IEEPA). That tariff was ruled illegal by the U.S. Supreme Court.
The latest tariff, which takes effect on Friday, is being imposed under Section 301 of the Trade Act of 1974, ostensibly to punish trading partners for not cracking down on imported goods made using forced labour. It represents a continuing effort by Mr. Trump to find legal authorities to fulfill his policy of across-the-board tariffs to protect U.S. industry from competition by foreign imports.
Mr. Carney on Thursday described the Section 301 tariffs as merely a “different justification” for imposing the same levies that Mr. Trump tried to put in place under IEEPA.
“It’s not unexpected what’s happening there. It’s part of the bigger puzzle,” he said.
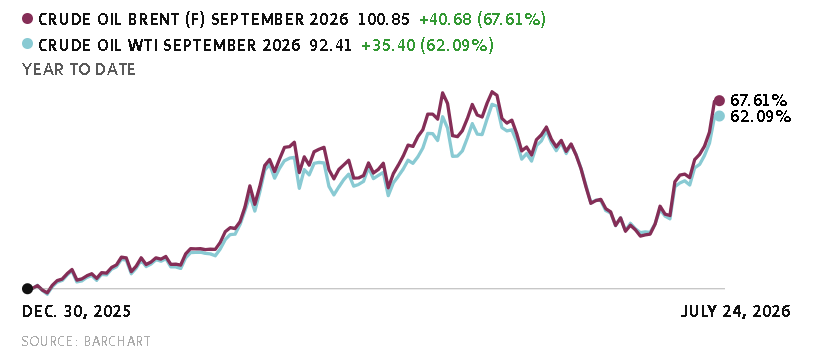
The latest tariffs will not apply to goods traded under the U.S.-Mexico-Canada Agreement or to any oil and gas, meaning Canadian goods will mostly be shielded from their effect. Mr. Trump’s other tariffs on Canada, both the autos and metals tariffs announced last year and the 50-per-cent tariffs set to take effect next month, apply to USMCA-covered goods.
Analysis: Trump’s latest tariff threats open new front in trade negotiations
Just how thorny the relationship with the U.S. has become was underscored by Erin O’Toole, a member of Mr. Carney’s Advisory Committee on Canada-U.S. Economic Relations. In an interview with The Globe and Mail, Mr. O’Toole said that the Prime Minister, other cabinet ministers and Canada’s ambassador to the U.S. were with Mr. Trump at the FIFA World Cup final the day before the President announced the new tariffs and that there was no heads up.
“It was kind of like a North American mini summit at the margins of the World Cup,” Mr. O’Toole said. “We used to call this relationship the Three Amigos, right? You’d think there’d be a courtesy to say we have some more tariff news coming, but no.”
The newly threatened tariffs are at a different scale than others, Mr. O’Toole said, and would make it very difficult for Canada to avoid a recession if they are imposed on Aug. 19. For Canada to be successful, Mr. O’Toole said the premiers need to unite behind Mr. Carney and allow the Prime Minister to be the sole spokesperson in order to avoid mixed messages or derailing talks.
At his press conference, Mr. Carney said he and the premiers are united as Canada navigates what the Prime Minister called “the latest in a series of unilateral and unwarranted trade actions” from Mr. Trump.
But provincial leaders have splintered in the past over how forceful a position to take with the U.S. and there were hints of that again this week.
The new 50-per-cent tariffs cover a wide range of goods but hit provincial economies unequally. For example, Alberta and Saskatchewan will see almost no effect on their exports, but the tariffs would put a tight squeeze on B.C., Quebec and Ontario.
Opinion: Canada’s best response to Trump’s latest tariff threats? Keep calm and carry on
That unequal economic impact demarcated the positions the premiers took at their annual summer gathering in PEI this week. Ontario’s Doug Ford and British Columbia’s David Eby were most forceful in their demands for a response to the new tariffs. Saskatchewan and Alberta, who are the sole provinces that still allow the sale of U.S. liquor, have long advocated for diplomacy.
Mr. Ford though was an outlier this week with how far he went in advocating for retaliation. The Premier again floated the idea that Canada could use its energy supply as leverage. He tried to go it alone last year by putting a surcharge on Ontario electricity exports but backed down within a day amid escalating tariff threats from the U.S.
This week, the Ontario Premier said, “We could dismantle the U.S. if we wanted to, if we all work together.” He pointed to potash and oil exports as key levers.
He accused Mr. Trump of turning on the Prime Minister like a “rabid dog” with Monday’s tariff salvo.
Late Thursday, Alberta Premier Danielle Smith told CBC News that putting energy on the table would be a “a very dumb decision” because the U.S. can shut down Line 5, which ships oil through the U.S. to southwestern Ontario.
“I don’t think you go into a negotiation promising to punch someone in the nose. You go into a negotiation talking about a win-win, and I think that that’s more the Prime Minister’s style, and I’m glad to see that,” she told CBC’s Power and Politics with David Cochrane.
Mr. Eby, too, cautioned against how provinces retaliate. “Volunteering somebody else’s resources for the fight” with the Americans is not something he would do, he told reporters after the meeting.
Where the premiers were unanimous was in a call for more transparency from Ottawa as it negotiates with Washington and timely communications. That was underscored by Quebec’s Christine Fréchette Thursday who demanded that her province have access to Ottawa’s negotiating plan.
Conservative House Leader Andrew Scheer criticized the Prime Minister for a lack of results more than a year into his mandate.
“He gives concession after concession, but doesn’t get anything in return,” Mr. Scheer told reporters in Regina.
The NDP has said that if the Aug. 19 tariffs are imposed, Canada should respond with countertariffs.
With a report from Maura Forrest in Montreal