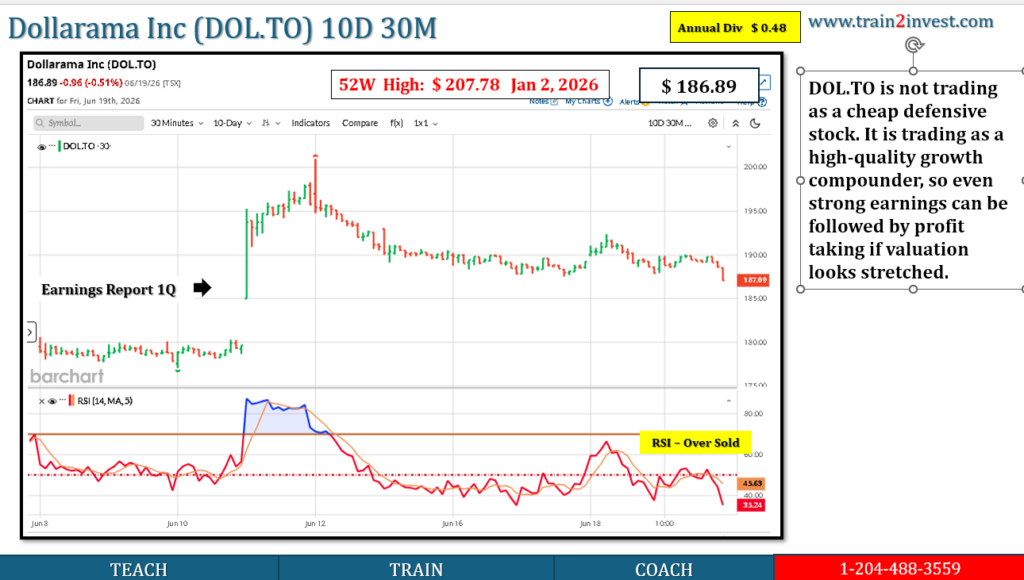
DOL.TO 10D Performance
- Dollarama closed at C$186.89 on June 19, 2026, down C$0.96 / -0.51% on the day.
- Using the available June price data, DOL.TO was around C$181.22 near the June 5 starting point, implying an approximate 10-trading-day move of +C$5.67 / +3.1%.
- The 10D move was not smooth: the stock jumped after Q1 results, then pulled back from the post-earnings high.
- Main catalyst: June 11 earnings beat — Q1 sales C$1.85B vs C$1.82B expected, adjusted EPS C$1.05 vs C$0.99 expected.
- Valuation remains the key risk: Barchart shows P/E ttm ~38.65x and forward dividend yield only ~0.24%, so the stock is priced as a premium compounder.
Data & Evidence
| Item | Value |
|---|---|
| Approx. start price | ~C$181.22 |
| Latest close, Jun 19 | C$186.89 |
| 10D price change | +C$5.67 |
| Approx. 10D return | +3.1% |
| Post-earnings high reference | ~C$200.99 on Jun 12 |
| Pullback from high to Jun 19 | about -7.0% |
Data gap: I could verify the Jun 19 close and the June pricing range, but the full daily 10-session table was not fully accessible from Yahoo due to fetch limits. Treat the +3.1% as a close-to-close approximation, not a tick-perfect official return.
Key Drivers
1. Earnings beat drove the spike
Dollarama beat Q1 expectations, with net sales of C$1.85B versus C$1.82B expected, and adjusted EPS of C$1.05 versus C$0.99 expected. Reuters reported that the shares rose about 7% in early trading after the results.
2. Defensive consumer-staples/value appeal
Dollarama benefits when consumers trade down to lower-priced essentials. Reuters cited “sticky inflation” and pressure on household budgets as reasons customers remain focused on value.
3. International growth narrative
The Mexico Dollarcity business and Australia’s The Reject Shop remain part of the growth story. Reuters noted analyst commentary that Mexico and Australia support the view that Dollarama’s model may be portable.
Valuation Logic
| Metric | Reading |
|---|---|
| Latest close | C$186.89 |
| P/E ttm | ~38.65x |
| EPS ttm | ~C$4.86 |
| Forward dividend | ~C$0.48/year |
| Forward yield | ~0.24% |
DOL.TO is not trading as a cheap defensive stock. It is trading as a high-quality growth compounder, so even strong earnings can be followed by profit taking if valuation looks stretched.
Scenarios — Next 1–3 Months
| Scenario | Price Bias | What Drives It |
|---|---|---|
| Bull | C$195–201 | Continued earnings momentum, strong same-store sales, confidence in Australia/Mexico expansion |
| Base | C$180–190 | Stock consolidates after post-earnings spike; valuation caps upside |
| Bear | C$170–180 | Multiple compression, margin pressure, weaker consumer spending, or disappointment in international rollout |
Actionable Takeaways
- 10D trend: Positive, approximately +3%, but the stock has already pulled back from the post-earnings surge.
- Support zone: C$181–183.
- Resistance zone: C$195–201.
- Thesis breaker: failure to hold around C$181 would suggest the earnings rally has faded.
- Main risk: valuation, not business quality.
Leave a Reply
You must be logged in to post a comment.