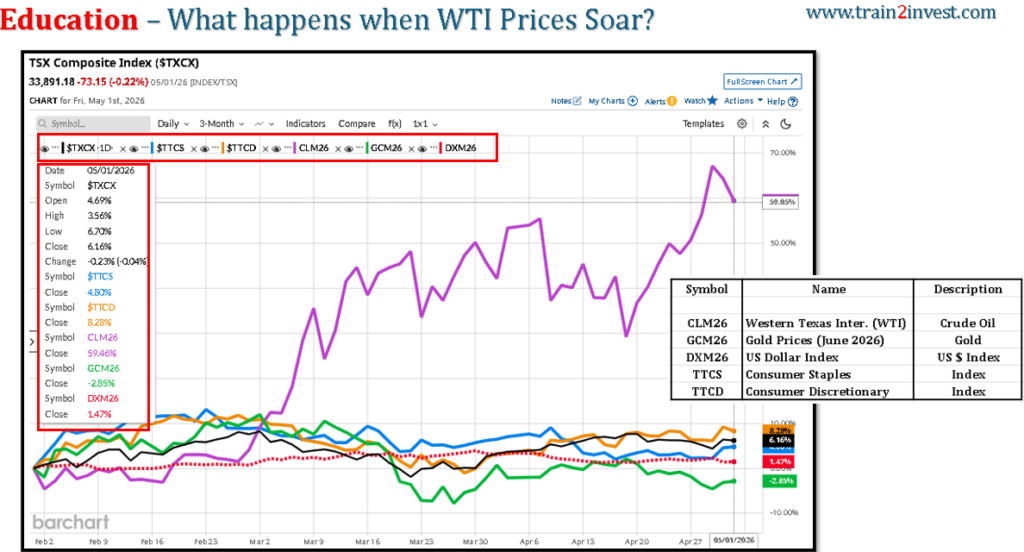
- The chart shows WTI crude (CLM26) rising sharply (~+59%) over ~3 months.
- TSX Composite (TXCX) rises modestly (~+6%), indicating partial positive correlation.
- Consumer Discretionary (TTCD) underperforms → pressured by higher energy costs.
- Consumer Staples (TTCS) is relatively stable → defensive behavior.
- Gold (GCM26) weakens (~−2.8%) while USD (DXM26) rises → typical risk/inflation dynamics.
What the Chart Is Showing (Data Interpretation)
Indexed Performance (approx from chart)
| Asset | Return | Direction |
|---|---|---|
| WTI Crude (CLM26) | +59% | Strong uptrend |
| TSX Composite (TXCX) | +6% | Moderate gain |
| Consumer Discretionary (TTCD) | +8.2% → fading | Weak relative |
| Consumer Staples (TTCS) | +4.8% | Stable |
| Gold (GCM26) | −2.8% | Declining |
| USD Index (DXM26) | +1.5% | Strengthening |
Key Drivers (Macro → Sector Transmission)
1) Macro: Oil Shock (Primary Driver)
- WTI +59% = major supply/demand imbalance
- Typically driven by:
- Geopolitical disruption (e.g., Hormuz risk)
- Supply constraints
Transmission:
- Higher oil → higher inflation expectations
- Central banks → maintain tighter policy
- Consumer purchasing power ↓
2) TSX Impact (Index Level)
- TSX is energy-heavy (~18–20%)
- Oil ↑ → Energy earnings ↑ → lifts index
Why TSX only +6% (not +59%)?
- Gains in energy offset by weakness in other sectors
- Consumer
- Industrials
- Rate-sensitive sectors
3) Sector-Level Effects
A) Consumer Discretionary (TTCD) → Weak
- Negative correlation with oil
Mechanism:
- Fuel costs ↑ → disposable income ↓
- Retail, autos, apparel demand ↓
Chart confirms:
- TTCD initially rises but loses momentum into late period
B) Consumer Staples (TTCS) → Defensive Stability
- Less sensitive to discretionary spending
Behavior:
- Holds value during inflation pressure
- Slight gain (~+4.8%) = capital preservation trade
C) Gold (GCM26) → Unexpected Weakness
- Normally benefits from inflation
Why down here:
- USD ↑ (− correlation with gold)
- Possibly:
- Real yields rising
- Liquidity tightening
D) USD Index (DXM26) → Rising
- Strong USD typically:
- Pressures commodities (except oil in supply shocks)
- Weakens gold
Economic Logic (Cause → Effect Chain)
WTI ↑ sharply →
- Inflation expectations ↑
- Interest rate expectations ↑
- Consumer spending power ↓
- Sector rotation:
- Into: Energy
- Out of: Discretionary
- TSX partially benefits due to energy weight
Valuation / Market Structure Insight
- This is a classic late-cycle / supply-shock setup:
- Energy = earnings upgrade cycle
- Consumer sectors = margin compression + demand risk
- Market is not pricing recession yet (since TSX still positive)
Risks (What Could Change This Relationship)
Short-term
- Oil reversal → immediate sector rotation back
- Weak economic data → TSX declines broadly
Medium-term
- Sustained oil > $100:
- Demand destruction risk
- Broader equity correction
Scenarios
Bull (for TSX)
- Oil stabilizes high but not rising
- Energy continues to lead
→ TSX +3–6%
Base Case
- Oil volatile, range-bound
→ Sector divergence continues
→ TSX flat to slightly positive
Bear Case
- Oil spike triggers recession fears
→ Broad selloff including TSX
→ −8–12%
What Would Disprove This Interpretation
- Discretionary stocks outperform despite rising oil
- Gold rises strongly alongside USD
- TSX declines despite energy strength
Actionable Takeaways
- Oil spikes create clear sector winners/losers:
- Winners: Energy, (sometimes) Financials
- Losers: Discretionary, Transport
- TTCD weakness is structural under oil shocks, not random
- TTCS acts as capital preservation, not growth
Leave a Reply
You must be logged in to post a comment.