Summary — L.TO 10D Performance
- Loblaw Companies Ltd. closed at C$64.09 on June 19, 2026, down C$0.67 / -1.03% on the day.
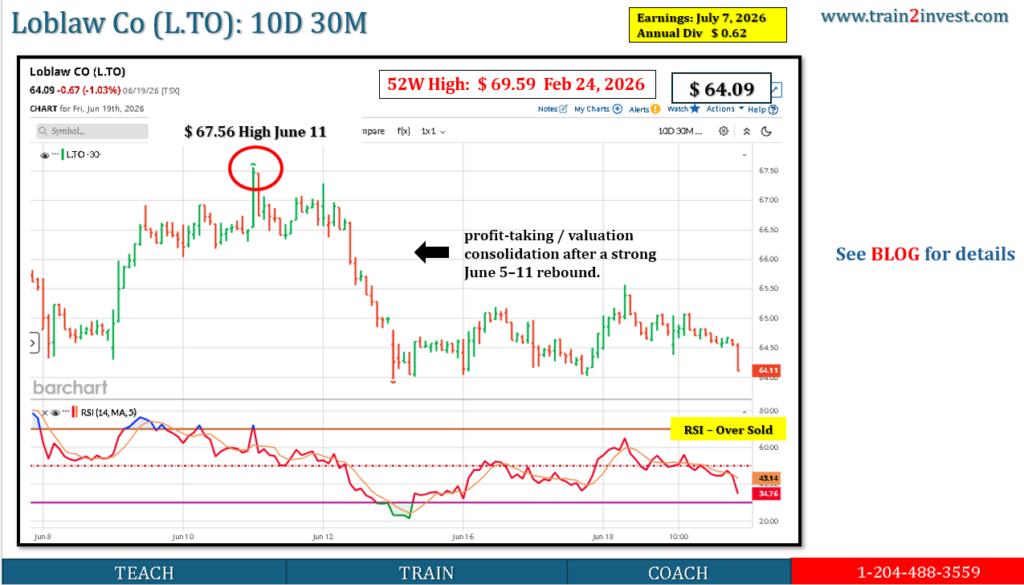
- Over the 10-trading-day window from June 5 to June 19, L.TO moved from C$65.53 to C$64.09.
- 10D performance: -C$1.44 / -2.20%.
- The stock rose to C$66.68 on June 11, then sold off sharply on June 12, falling -2.52%.
- The move was not business-collapse driven; it looks more like profit-taking / valuation consolidation after a strong June 5–11 rebound.
Data & Evidence
| Date | Close | Daily Move |
|---|---|---|
| Jun 5 | C$65.53 | +3.62% |
| Jun 8 | C$64.73 | -1.22% |
| Jun 9 | C$66.30 | +2.43% |
| Jun 10 | C$66.47 | +0.26% |
| Jun 11 | C$66.68 | +0.32% |
| Jun 12 | C$65.00 | -2.52% |
| Jun 15 | C$64.59 | -0.63% |
| Jun 16 | C$64.88 | +0.45% |
| Jun 17 | C$64.69 | -0.29% |
| Jun 18 | C$64.76 | +0.11% |
| Jun 19 | C$64.09 | -1.03% |
Source: Investing.com historical data for Loblaw Companies Ltd.
Calculation:
C$64.09 ÷ C$65.53 − 1 = -2.20%
Key Drivers
1. Reversal after early strength
L.TO rallied from C$65.53 on June 5 to C$66.68 on June 11, then declined to C$64.09 by June 19. That means the stock gave back the early 10D gain and finished the period lower.
2. Defensive business, but valuation still matters
Loblaw’s business fundamentals remain defensive. In Q1 2026, the company reported revenue of C$14.724B, up 4.2% YoY, Food Retail same-store sales +2.4%, and Drug Retail same-store sales +4.1%.
However, defensive stocks can still decline when investors rotate, take profits, or question valuation after a strong run.
3. Earnings were solid, but not enough for a breakout
Q1 adjusted diluted EPS rose 10.6% YoY to C$0.52, and retail operating income rose 20.5% YoY.
The issue is that the market may already be pricing in Loblaw’s stable earnings profile, so the stock needed either stronger guidance or a broader defensive-sector bid to keep moving higher.
4. TTCS relevance
Unlike DOL.TO, Loblaw is part of TTCS. Its -2.20% 10D move likely contributed to TTCS’s slightly negative performance over the same period.
Valuation / Positioning
| Metric | Reading |
|---|---|
| Latest close | C$64.09 |
| 10D change | -C$1.44 |
| 10D return | -2.20% |
| 10D high close | C$66.68 |
| Pullback from 10D high | -3.88% |
| 52-week range | C$52.92–C$69.59 |
L.TO remains closer to the upper half of its 52-week range, so short-term pullbacks can occur even when fundamentals remain intact.
Scenarios — Next 1–3 Months
| Scenario | Price Bias | What Drives It |
|---|---|---|
| Bull | C$67–70 | Defensive rotation resumes, grocery/pharmacy sales stay firm, margin discipline continues |
| Base | C$62–67 | Stock consolidates; fundamentals stable but valuation limits upside |
| Bear | C$58–62 | Consumer pressure, margin compression, weak sector sentiment, or broader TSX weakness |
Actionable Takeaways
- 10D trend: mildly negative, -2.20%.
- Support zone: C$63.50–64.00, then C$62.00.
- Resistance zone: C$66.50–67.00.
- Main short-term issue: failed to hold the June 11 high near C$66.68.
- Thesis breaker: sustained move below C$62 would suggest a deeper correction rather than normal consolidation.
Leave a Reply
You must be logged in to post a comment.