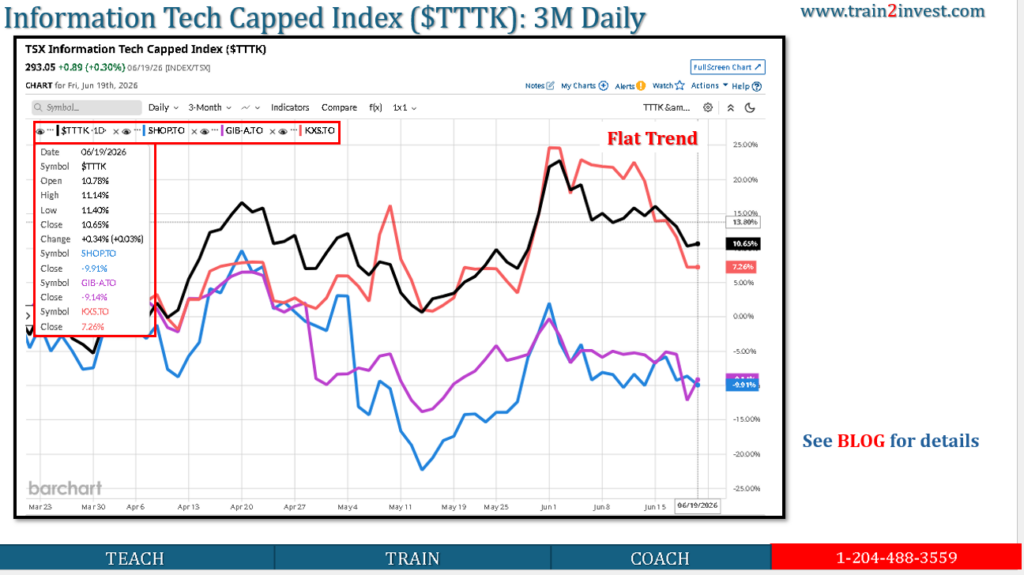
Summary — TTTK 5D Performance
- TTTK = S&P/TSX Capped Information Technology Index.
- Latest close available: 293.05 on June 19, 2026, up 0.30% that day.
- Using the standard 5-trading-day close-to-close method, from June 12 close to June 19 close, TTTK fell from 303.83 to 293.05.
- 5D performance: -10.78 points / -3.55%.
- Main issue: Canadian tech gave back prior strength, especially after June 16–18 weakness.
Data & Evidence
| Date | TTTK Close | Daily Move |
|---|---|---|
| Jun 12 | 303.83 | -0.99% |
| Jun 15 | 307.50 | +1.21% |
| Jun 16 | 303.45 | -1.32% |
| Jun 17 | 299.67 | -1.25% |
| Jun 18 | 292.16 | -2.51% |
| Jun 19 | 293.05 | +0.30% |
Calculation:
293.05 ÷ 303.83 − 1 = -3.55%
Source: Investing.com historical data for S&P/TSX Capped Information Technology Index.
Key Drivers
1. Broad tech pullback after prior gains
TTTK rose into June 15, then declined for three straight sessions from June 16 to June 18. The largest drag was June 18: -2.51%.
2. High concentration in a few names
The index is heavily concentrated. XIT, the iShares ETF tracking the same benchmark, lists 19 holdings and a P/E ratio of 44.49x as of June 18, 2026. That means moves in a few large holdings can dominate short-term index performance.
3. Main constituent exposure
BlackRock’s May 31, 2026 XIT fact sheet shows the top holdings as Constellation Software, Celestica, Shopify, CGI, Descartes, Open Text, BlackBerry, Kinaxis, Lightspeed, and Enghouse. The top 10 represented 98.68% of the portfolio, so TTTK is not broadly diversified like the full TSX Composite.
Valuation Logic
| Item | Reading |
|---|---|
| Latest TTTK close | 293.05 |
| 5D start close | 303.83 |
| 5D change | -10.78 points |
| 5D return | -3.55% |
| XIT P/E | 44.49x |
| XIT P/B | 6.23x |
| XIT holdings count | 19 |
At a 44x P/E, the sector is valuation-sensitive. When investors reduce risk exposure or discount rates rise, high-multiple tech typically underperforms.
Scenarios — Next 1–3 Weeks
| Scenario | TTTK Bias | What Drives It |
|---|---|---|
| Bull | 300–308 | Shopify / Celestica rebound, U.S. tech strength, lower yields |
| Base | 290–300 | Consolidation after recent pullback |
| Bear | 280–290 | Continued multiple compression, weak large-cap tech, risk-off TSX trading |
Actionable Takeaways
- 5D trend: negative, -3.55%.
- Support zone: 290–292.
- Resistance zone: 300–308.
- Key driver: performance of the top three holdings — Constellation Software, Celestica, and Shopify.
- Thesis breaker: sustained break below 290 would confirm a deeper short-term correction.
Leave a Reply
You must be logged in to post a comment.