Author: Consultant

  • Apr 18/26: Iran reverses course on reopening Strait of Hormuz, signals warning to US

    Iran has reversed it’s decision to reopen the Strait of Hormuz, citing an ongoing U.S. naval blockade. A regional intelligence official has confirmed to Fox News’ Trey Yingst that the Strait of Hormuz is “under full IRGC control and effectively closed at this moment.” Multiple vessels have already been forced to turn around, and the IRGC reportedly opened fire on at least one ship.

    • This reversal comes after Iran’s Foreign Minister Abbas Araghchi on Friday declared the Strait of Hormuz open while a 10-day ceasefire was announced between Israel and Iran-backed Hezbollah terrorists in Lebanon.
    • President Donald Trump had told reporters Friday that Iran agreed to all of his demands, including to allow the U.S. to collect uranium from the country. Iran has denied such claims.President Donald Trump said Friday the U.S. blockade on Iranian ports would remain in effect despite Iran announcing the Strait of Hormuz would reopen. He has insisted Iran “cannot have a nuclear weapon.”
    • U.S. Central Command (CENTCOM) said that 23 ships had complied with direction from U.S. forces and turned around since the blockade went into effect. Photos showed AH-64 Apaches fly above the Strait of Hormuz during a patrol on Friday.

    https://www.foxnews.com/live-news/trump-iran-us-war-strait-hormuz-blockade-israel-lebanon-april-18

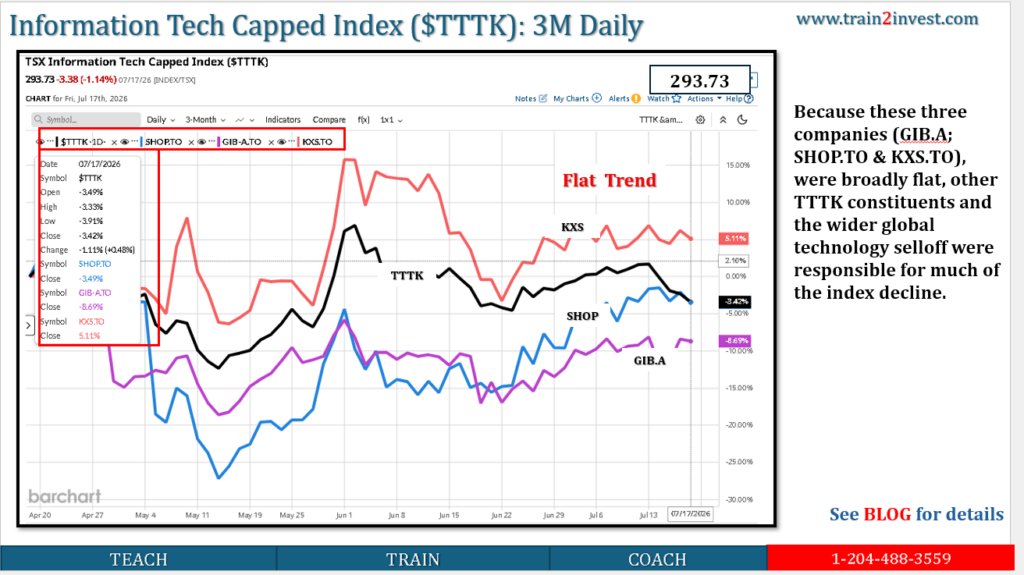
  • TTTK: SHOP.TO & KXS.TO

    Executive Summary

    • Shopify Inc.: ~+6–10% over ~10 days, driven by tech sector rally + analyst upgrades + “buy-the-dip” flows.
    • Kinaxis Inc.: ~+3–6% over ~10 days, rebound from lows on positive growth outlook + partnerships + technical recovery.
    • Move is macro + sector-led (tech rebound), not purely company-specific.
    • Both stocks were previously under pressure → rebound = positioning reset.
    • Short-term strength ≠ confirmed trend reversal; still within volatile tech regime.

    1) Shopify (SHOP.TO) — Why it increased

    Key Drivers

    1) Tech sector rotation (primary driver)

    • TSX tech sector +3.6% in a single session, led by Shopify (+8.1%)
    • Trigger:
      • Geopolitical de-escalation (risk-on sentiment)
      • Rotation back into growth / SaaS

    Implication:

    • Shopify is a high-beta tech proxy → moves disproportionately when risk appetite improves

    2) “Buy-the-dip” after prior selloff

    • Stock was:
      • ~−24% YTD
      • ~−34% from 52-week high

    Interpretation:

    • Investors saw valuation reset → re-entry point
    • Short-term flows:
      • Systematic funds + discretionary “dip buyers”

    3) Analyst support + upgrades

    • Recent:
      • Upgrades to “Outperform”
      • Consensus still Buy / Moderate Buy

    Implication:

    • Reinforces narrative:
      • Long-term growth intact
      • Near-term upside vs depressed levels

    4) Structural growth story still intact

    • Revenue growth:
      • ~30% YoY
    • Tailwinds:
      • AI-enabled commerce
      • B2B expansion

    Interpretation:

    • Market is re-pricing long-duration growth, not reacting to new earnings

    Bottom Line (SHOP)

    • Increase = macro-driven + valuation rebound
    • Not driven by:
      • New earnings
      • New company-specific catalyst
    • Character: high-beta rebound rally

    2) Kinaxis (KXS.TO) — Why it increased

    Key Drivers

    1) Technical rebound after consolidation

    • Price path:
      • ~C$134 → ~C$146 (Apr 10 → Apr 15)
      • ~+4–6% move

    Interpretation:

    • Recovery from:
      • Short-term pullback
      • Support levels (~C$135)

    2) Positive fundamental narrative (SaaS growth)

    • Guidance:
      • SaaS revenue growth: 17–19%
      • Increasing large enterprise deals

    Implication:

    • Reinforces:
      • Recurring revenue visibility
      • High-quality SaaS profile

    3) Strategic partnership catalyst (incremental)

    • New:
      • Partnership expansion (TraceLink integration)

    Impact:

    • Strengthens:
      • Platform positioning
      • Supply-chain AI narrative

    4) Undervaluation vs historical levels

    • Stock:
      • ~−40% from all-time highs

    Interpretation:

    • Similar to Shopify:
      • Re-rating from depressed levels
      • Not chasing highs → early-stage recovery

    Bottom Line (KXS)

    • Increase = fundamental support + technical rebound
    • More idiosyncratic + fundamental vs Shopify’s macro-driven move

    3) TTTK (TSX Technology Index proxy)

    What happened

    • TSX tech sector broadly:
      • Strong rebound over the period
      • Driven by:
        • Risk-on sentiment
        • AI / SaaS re-rating
        • Recovery from prior weakness

    Interpretation:

    • Both SHOP + KXS moves are consistent with sector beta

    Data & Evidence

    Stock~10-day MovePrimary DriverNature
    SHOP.TO+6–10%Tech rally + dip buyingMacro-driven
    KXS.TO+3–6%SaaS fundamentals + reboundMixed
    TSX Tech+3–4% (sector spikes)Risk-on rotationBroad

    Valuation Logic

    Shopify

    • Before: Overvalued → derated
    • Now: Partial re-rating
    • Driver: multiple expansion (not earnings)

    Kinaxis

    • Before: Undervalued vs history
    • Now: early recovery phase
    • Driver: growth + normalization

    Risks (both names)

    1. Reversal of risk-on sentiment
    2. Rates remaining high → pressure on tech multiples
    3. AI disruption narrative (esp. software sector)
    4. Earnings misses (next key catalyst)

    Scenarios (3-month view)

    Bull (30%)

    • Continued tech rally
    • SHOP → +10–20%, KXS → +8–15%

    Base (50%)

    • Range-bound consolidation
    • SHOP → ±5–10%, KXS → ±5–8%

    Bear (20%)

    • Macro reversal / rates spike
    • SHOP → −15%, KXS → −10–15%

    What Would Disprove This View

    • Sustained earnings-driven upside (not just macro)
    • Continued high-volume accumulation
    • Upward EPS revisions across tech sector

    Actionable Takeaways

    • Recent gains are primarily macro + positioning-driven, not new fundamentals.
    • Shopify = high-beta rebound trade.
    • Kinaxis = fundamental + technical recovery hybrid.
    • Both remain sensitive to interest rates and sentiment shifts.
  • Saputo Inc. :  (SAP.TO)  10D 30M

    Executive Summary

    • Saputo (SAP.TO) declined ~9–11% over ~10 days (mid-April), including a ~9% single-day drop.
    • The move followed a 52-week high (~C$44) reached just days earlier → classic post-peak correction.
    • No new negative company-specific catalyst → primarily technical + valuation-driven.
    • Fundamentals remain stable to improving (EBITDA growth, defensive sector).
    • Market is repricing for higher valuation + slower top-line growth + defensive rotation fading.

    Key Drivers

    1) Technical reversal after peak (primary)

    • Timeline:
      • Apr 7: New 52-week high (~C$44.10)
      • Apr 13–15: sharp decline to ~C$40 → high-$30s
    • 10-day move: ~−10%

    Interpretation:

    • Classic “breakout → failure → reversal” pattern
    • Triggered by:
      • Overbought conditions
      • Short-term momentum unwind
      • Systematic selling (quant / technical)

    2) Profit-taking after strong 1-year performance

    • 1-year return:
      • ~+50% to +75%+ depending on period

    Implication:

    • Stock had outperformed TSX materially
    • Defensive staples (like Saputo) became crowded trades
    • Pullback reflects:
      • Position unwinding
      • Not deterioration in earnings

    3) Valuation compression (key fundamental driver)

    • P/E ~27x (consumer staples premium)
    • Analyst target:
      • ~C$46 vs price ~C$40–41 → limited near-term upside

    Interpretation:

    • Market shifting from:
      • “premium defensive multiple”
        → “normalized multiple”

    Drivers of compression:

    • Rates still elevated
    • Rotation away from defensives
    • Limited revenue growth vs valuation

    4) Revenue growth lag vs earnings growth

    • Q3 FY2026:
      • Revenue growth modest / mixed
      • Profit improved mainly via efficiency gains

    Implication:

    • Market concern:
      • Earnings quality vs sustainability
      • Cost-driven gains vs organic growth

    5) Technical sell signals amplified downside

    • Signals triggered:
      • Pivot-top sell signal (Apr 10)
      • Breakdown below short-term averages
      • “No strong support below” near-term

    Interpretation:

    • Once breakdown occurred:
      • Stop-loss cascade
      • Momentum funds exit

    Data & Evidence

    MetricObservationSignal
    10-day move~−10%Sharp correction
    Single-day move~−9%Event-level selloff
    Prior trend52-week highOverbought
    1-year return+50–75%Extended
    P/E~27xPremium valuation
    EarningsStrong EBITDA growthFundamentals intact

    Valuation Logic

    Before drop:

    • Priced for:
      • Stable defensive growth
      • Margin expansion
      • Low volatility premium

    After drop:

    • Repricing toward:
      • Slower organic growth
      • Normalized margins
      • Lower multiple (~mid-20s → low-20s implied)

    Key point:

    • Earnings unchanged → multiple compression explains move

    Risks Being Priced

    1. Top-line growth limitations (mature dairy market)
    2. Margin sustainability (cost-driven gains)
    3. Rotation out of defensive staples
    4. Trade / dairy policy uncertainty (background risk)

    Scenarios (3-month horizon)

    Bull (25%)

    • Defensive rotation resumes
    • Margin expansion continues
    • Range: C$42–46

    Base (50%)

    • Earnings stable, multiple compressed
    • Range: C$38–42

    Bear (25%)

    • Revenue disappoints / margin fades
    • Range: C$34–38

    What Would Disprove This View

    • Upward revisions to revenue growth outlook
    • Strong organic volume growth (not just cost control)
    • Sustained price recovery with volume confirmation

    Actionable Takeaways

    • The decline is primarily technical + valuation reset, not driven by new negative fundamentals.
    • The stock moved from:
      • defensive momentum → consolidation phase
    • Key near-term indicators:
      • Revenue growth (not just margins)
      • Volume confirmation on rebounds
      • Sector rotation (defensive vs cyclical)
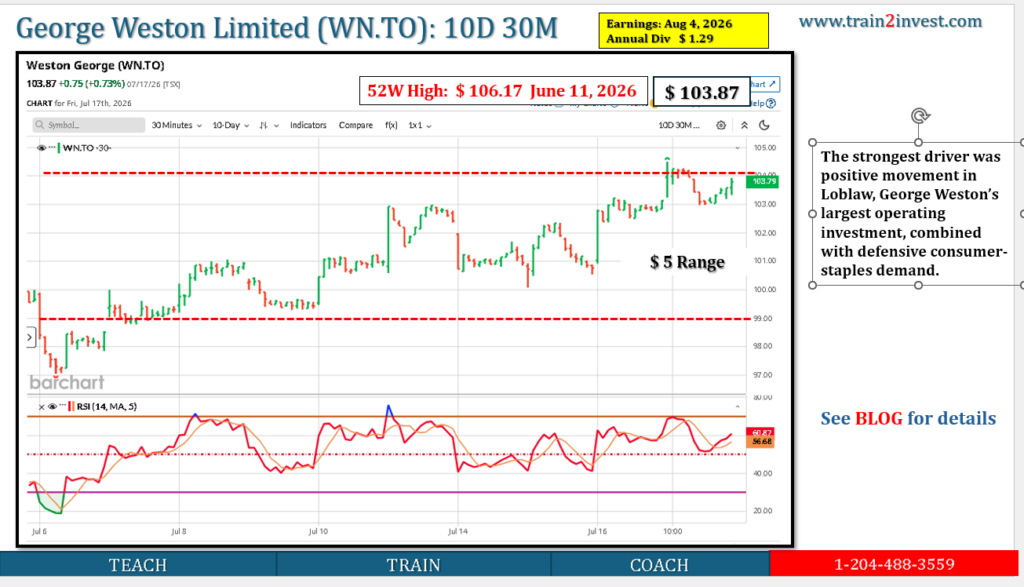
  • George Weston Limited Commits $600 Million Equity Investment to Choice Properties REIT in Connection with Its Proposed Acquisition of Real Estate Assets from First Capital REIT

    TORONTO, April 16, 2026 (GLOBE NEWSWIRE) — George Weston Limited (“GWL”) (TSX: WN) today announced it has committed to a $600 million equity investment in Choice Properties REIT (“Choice Properties”) (TSX: CHP.UN). The commitment has been made in connection with Choice Properties’ expected acquisition of approximately $5.0 billion of assets from First Capital REIT (“First Capital”), announced earlier today (the “Acquisition”).

    Richard Dufresne, President and Chief Financial Officer of GWL, said, “We are pleased to support Choice Properties in this strategic and defining transaction. This Acquisition is expected to enhance the quality of Choice Properties’ portfolio and strengthen its long-term growth profile. Our continued majority ownership underscores our confidence in Choice Properties’ ability to deliver stable and growing cash flows and create long-term value for its unitholders and GWL shareholders.”

    Choice Properties is expected to finance the Acquisition through the issuance of approximately $1.7 billion of new equity, with the balance funded through debt, including the assumption of certain debt of First Capital.

    GWL intends to finance the equity commitment through a combination of its existing credit facilities and the issuance of additional indebtedness. GWL’s equity commitment, which is to be funded concurrent with the closing of the Acquisition, will result in the issuance of approximately 38.0M Choice Properties trust units. Upon completion of the Acquisition, GWL is expected to maintain its majority ownership position in Choice Properties with an approximate 58% interest. The investment is not expected to impact GWL’s current share buyback program.

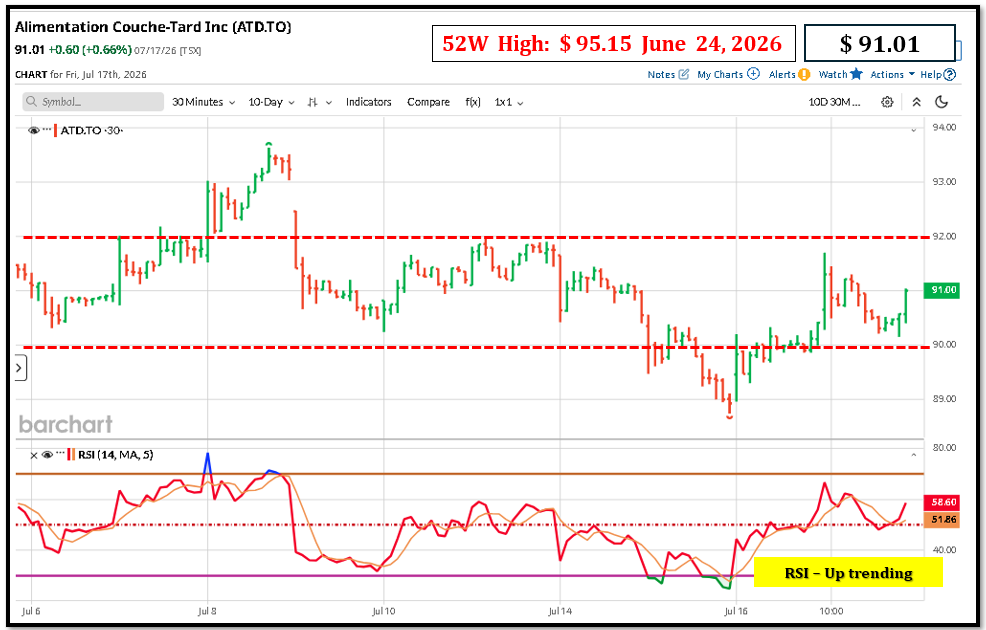
  • Alimentation Couche-Tard Inc. (ATD.TO):

    Executive Summary

    • Alimentation Couche‑Tard (ATD.TO) declined ~8–10% over the past ~10 days (into mid-April 2026).
    • No company-specific negative news → pullback is sentiment/positioning-driven, not fundamental deterioration.
    • Stock had been near highs (Feb peak) → recent move is mean reversion / profit-taking.
    • Underlying fundamentals remain strong (double-digit EBITDA / EPS growth).
    • Market is repricing for consumer softness + fuel demand normalization + valuation compression.

    Key Drivers

    1) Profit-taking after extended run (primary)

    • ATD hit a 52-week high in late Feb 2026
    • Recent drop: ~6–10% from peak levels

    Interpretation:

    • Classic de-risking after momentum phase
    • High-quality compounders like ATD often correct without news when positioning is crowded

    2) Valuation compression (market-driven)

    • Stock still:
      • +15% YoY
      • +3–4% YTD

    Implication:

    • Market shifting from:
      • “growth premium” → “normalized multiple”
    • Even with strong earnings, multiples compress when:
      • Rates remain elevated
      • Defensive rotation fades

    3) Consumer demand normalization (underlying concern)

    • Structural pressure:
      • Fuel volumes + discretionary spend tied to consumer health
    • Evidence (sector-wide, not new):
      • Weak demand trends linked to inflation + reduced travel/activity

    Implication:

    • Market pricing:
      • Slower same-store sales growth
      • Lower fuel margin upside vs prior quarters

    4) Strong earnings already priced in (no upside surprise)

    • Q3 FY2026:
      • EBITDA +14–15% YoY
      • EPS +19% YoY

    Interpretation:

    • Results were strong but not incremental catalyst
    • Stock reaction:
      • “Good results, no new upside → sell the news”

    5) Event-driven uncertainty (secondary)

    • Ongoing strategic narrative:
      • M&A optionality (e.g., large acquisitions)
      • Share buybacks supporting valuation
    • But:
      • Lack of new deal clarity → reduces near-term catalysts

    Data & Evidence

    MetricObservationSignal
    10-day move−8% to −10%Moderate correction
    1-year return~+15%Still positive trend
    Q3 EBITDA+14.7% YoYStrong fundamentals
    EPS growth+19% YoYEarnings intact
    Recent newsNo negative catalystTechnical-driven

    Valuation Logic

    • Pre-pullback: priced for continued margin expansion + M&A upside
    • Post-pullback: pricing:
      • Normalized fuel margins
      • Moderate consumer demand
      • Lower multiple expansion

    Key point:

    • Earnings unchanged → multiple contraction explains most of the move

    Risks Being Priced

    1. Fuel margin normalization (peak behind us)
    2. Consumer slowdown (traffic + basket size)
    3. Execution risk on large acquisitions
    4. FX volatility (USD exposure)

    Scenarios (3-month framing)

    Bull (30%)

    • Fuel margins remain elevated
    • M&A catalyst re-emerges
    • Range: C$82–88

    Base (50%)

    • Stable earnings, lower multiple
    • Range: C$75–82

    Bear (20%)

    • Consumer weakness + margin compression
    • Range: C$68–74

    What Would Disprove This View

    • Material same-store sales decline in next earnings
    • Fuel margin compression beyond expectations
    • Negative guidance revision

    Actionable Takeaways

    • The decline is not driven by deteriorating fundamentals.
    • It reflects valuation reset + positioning unwind, not earnings risk.
    • ATD has shifted from:
      • momentum compounder → consolidation phase
    • Key near-term signals:
      • Same-store sales trends
      • Fuel margins
      • Capital allocation (buybacks vs acquisitions)
  • Canadians are getting a one-time grocery payment this summer. Here’s when

    Canadians will see their one-time groceries benefit payment on June 5, Canada Revenue Agency (CRA) Secretary of State Wayne Long announced Friday.

    It’s part of the government’s new Canada Groceries and Essentials Benefit (CGEB), which will replace the existing GST/HST credit.

    Long cautioned Canadians that they must file their income tax return in order to be eligible for the refund.

    Anyone who was eligible for the existing GST/HST rebate will also be eligible for the CGEB. See this guide if you’re not sure if you qualify.

    How much will you get?

    Qualifying Canadians will receive a payment based on their familial status.

    Single Canadians and single-parent families will get a maximum payout of:

    • $267 with no children
    • $441 with one child
    • $533 with two children
    • $625 with three children
    • $717 with four children

    Married or common-law individuals will get a maximum payment of:

    • $349 with no children
    • $441 with one child
    • $533 with two children
    • $625 with three children
    • $717 with four children

    The one-time payment is in addition to the overall quarterly benefit amount.

    Combined, a family of four could receive up to $1,890 in 2026, and a single person could receive up to $950 in 2026, including the top-up, according to the CRA.

    The benefit will be indexed to inflation, Long added.

    “This means the amounts paid to Canadians each year will increase and be adjusted with the cost of living,” he said.

    “As a society, as a country, and as a government, we should be judged by how we reach out, look after, and protect our most vulnerable.”

    Canadian food prices

    Statistics Canada reported prices on basics at the grocery store have jumped since the start of 2026. A whole chicken cost $8.57 per kilogram on average in February (the most recent reference period), up more than a dollar from the month before.

    Ground beef rose $1.10 per kilogram and bananas were up 14 cents per kilogram. Some prices also fell from January to February. A 500-gram pack of bacon, for example, fell six cents. Chicken drumsticks dropped by 55 cents per kilogram.

    However, that data does not include the most recent effects on shipping costs caused by the war in Iran, which led to worldwide spikes in gas costs due to the closure of the Strait of Hormuz.

  • Iran declares Strait of Hormuz open to shipping but Trump says U.S. blockade still active

    • Iran’s foreign minister declared the Strait of Hormuz open to all commercial ships during the ceasefire between Israel and Lebanon.
    • President Donald Trump thanked Tehran for opening the strait, but said the U.S. blockade of Iran’s ports remains in effect.
    • Iranian media affiliated with the Revolutionary Guard described a limited reopening of the strait. It will close if the U.S. blockade continues, according to Tasnim News.

    https://www.cnbc.com/2026/04/17/iran-war-hormuz-strait-israel-lebanon-ceasefire.html

  • Apr 16/26: Bank Of Nova Scotia(BNS.TO)

    The Bank of Nova Scotia provides various banking products and services in Canada, the United States, Mexico, Peru, Chile, Colombia, the Caribbean and Central America, and internationally. It operates in four segments: Canadian Banking, International Banking, Global Wealth Management, and Global Banking and Markets. The company offers financial advice and solutions, and day-to-day banking products, including debit and credit cards, chequing and saving accounts, investments, mortgages, loans, and insurance to individuals; and business banking solutions comprising lending, deposit, cash management, and trade finance solutions to small, medium, and large businesses, including automotive financing solutions to dealers and their customers. It also provides wealth management advice and solutions, including online brokerage, mobile investment, full-service brokerage, trust, private banking, and private investment counsel services; and retail mutual funds, exchange traded funds, liquid alternative funds, and institutional funds. In addition, the company offers international banking services for retail, corporate, and commercial customers; and lending and transaction, investment banking advisory, and capital markets access services to corporate customers. Further, it provides online, mobile, and telephone banking services. The company operates a network of 954 branches and approximately 3,766 automated banking machines in Canada; and approximately 1,300 branches and a network of contact and support center internationally. The Bank of Nova Scotia was founded in 1832 and is headquartered in Halifax, Canada.

    How the Company Makes Money

    Scotiabank generates revenue through multiple key streams. The primary source is net interest income, which arises from the difference between interest earned on loans and interest paid on deposits. This includes personal loans, mortgages, and commercial lending. Additionally, the bank earns substantial fees from wealth management services, investment banking activities, and transaction-based services such as account maintenance and credit card fees. Scotiabank also benefits from trading and investment income derived from its capital markets division, which engages in trading securities and providing advisory services. Collaborations with other financial institutions and technology partners enhance Scotiabank’s service offerings and operational efficiencies, contributing to its overall revenue generation. Furthermore, the bank’s international operations, particularly in growth markets, provide additional avenues for earnings, helping to diversify its revenue base.

  • Apr 16 – Mkt. Update : Banks / RY.TO

    Updated 3-Month Forecast (mid-April to mid-July 2026) for Canadian Big 6 Banks (TSX-listed).

    Current approximate prices (as of approx.. April 16, 2026): TD.TO $142 CAD, RY.TO $240 CAD, BMO.TO $204 CAD, BNS.TO $103 CAD, NA.TO $201 CAD, CM.TO $147 CAD.

    Sector setup remains similar: Q1 2026 earnings were strong across the board (all banks beat estimates, collective $$19B profit, driven by revenue/wealth/capital markets strength, stable credit). Valuations are elevated after the 2025 rally and continued gains into 2026, with most stocks trading near or above consensus 12-month targets. Limited upside overall, range-bound trading likely, with dispersion based on U.S. exposure, yield, and domestic vs. international mix.

    Consensus view: Banks near peak multiples; forward returns compressed. Earnings growth mid-single digits expected. Rate path, consumer/housing credit, and loan growth are key watchpoints.

    3-Month Forecast (Range + Bias)

    TickerDirection3M Range (CAD)Basis
    TD.TOFlat to slight down135–148Trading near/above most targets ($C$139–142 consensus). Strong Q1 but already re-rated; U.S. exposure adds volatility.
    RY.TOSlight up / most stable235–255Highest consensus targets ($C$244–253); diversified, wealth/capital markets tailwinds support modest drift.
    BMO.TOFlat195–215Targets cluster $C$205–211; U.S. operations help but valuation caps upside.
    BNS.TOSlight up100–110Yield support + international exposure; targets $C$106–112 provide mild positive bias.
    NA.TOFlat to slight down190–205Strong recent performance and beats, but trading well above some historical/prior targets; mean-reversion risk higher.
    CM.TOFlat140–152Targets $C$144–153; solid but limited room after recent strength.

    Relative positioning: RY and BNS remain better placed for stability/modest gains. NA, CM, and BMO carry higher pullback risk if credit or macro data softens.

    Key Drivers (Next 90 Days)

    • Earnings cycle: Q2 reports in May/June — focus on NIM trends, loan growth, and PCLs (provisions for credit losses).
    • Macro: Any acceleration in rate cuts could pressure NIM; consumer credit stress or housing softness adds downside skew.
    • Capital markets/wealth: Continued strength provides support (as seen in Q1).
    • Valuation: Sector already priced for good outcomes; upside requires consistent beats.

    Valuation Logic Most names sit at 0–5% from 12-month targets → favors trading ranges over trends. Post-2025 rally ($strong gains) + 2026 performance leaves lower expected returns. P/E multiples above long-term averages.

    Risks

    • Higher credit losses (consumer, housing, commercial).
    • Faster NIM compression from rate environment.
    • Weaker loan growth or macro shock (trade, recession signals).
    • Any U.S.-specific issues for TD/BMO.

    Scenarios (Probability)

    • Bull (20%): Continued earnings beats + benign rates/credit → +5–8% sector move.
    • Base (60%): Inline results, stable macro → ±4–6% range-bound.
    • Bear (20%): Credit deterioration or weak data → -8–12% pullback.

    Actionable Takeaways Expect choppy, range-bound action rather than a clear trend. Favor RY and BNS for relative outperformance or defensiveness. NA/CM/BMO more prone to mean reversion. Next earnings cycle is the primary re-rating catalyst — watch for guidance on credit and growth. No major trend expected without a clear macro shift.

    Royal Bank of Canada (RY.TO)

    • Next Earnings Date: May 28, 2026 (est.)
    • Annual Dividend  $ 6.56

    RECOMMENDED FOR RRSP/TFSA based on Dividend Income.

    Royal Bank of Canada operates as a diversified financial service company worldwide. The company’s Personal & Commercial Banking segment offers checking and savings accounts, home equity financing, personal lending, private banking, indirect lending, including auto financing, mutual funds and self-directed brokerage accounts, guaranteed investment certificates, credit cards, and payment products and solutions; and lending, leasing, deposit, investment, foreign exchange, cash management, auto dealer financing, trade products, and services to small and medium-sized commercial businesses. This segment offers financial products and services through branches, automated teller machines, and mobile sales network. Its Wealth Management segment provides a suite of advice-based solutions and strategies to high net worth and ultra-high net worth individuals, and institutional clients. The company’s Insurance segment offers life, health, home, auto, travel, wealth, annuities, and reinsurance advice and solutions; and business insurance services to individual, business, and group clients through its advice centers, RBC insurance stores, and mobile advisors; digital, mobile, and social platforms; independent brokers; and travel partners. Its Investor & Treasury Services segment provides asset servicing, custody, payments, and treasury services to financial and other investors; and fund and investment administration, shareholder, private capital, performance measurement and compliance monitoring, distribution, transaction banking, cash and liquidity management, foreign exchange, and global securities finance services. The company’s Capital Markets segment offers corporate and investment banking, as well as equity and debt origination, distribution, advisory services, sale, and trading services for corporations, institutional investors, asset managers, private equity firms, and governments. The company was founded in 1864 and is headquartered in Toronto, Canada.

    How the Company Makes Money

    RBC makes money primarily by earning net interest income and generating fee-based revenue across its major business lines. 1) Net interest income (banking spread): A core earnings driver is the spread between interest earned on loans and other interest-earning assets (e.g., personal and commercial loans, mortgages, credit cards, and certain securities) and interest paid on deposits and other funding sources. Higher loan balances, favorable deposit mix, and wider spreads generally support this income; credit losses (loan impairments) reduce profitability. 2) Fees and commissions from client services: RBC earns non-interest revenue from service charges and account fees (e.g., certain banking packages and transaction services), card-related fees, payment processing and cash management fees for businesses, and various administrative and transaction fees tied to client activity. 3) Wealth management and asset management fees: Through wealth management activities, RBC earns recurring fees based on assets under management/administration, as well as commissions and advisory fees from brokerage services, financial planning, portfolio management, and related client advice. Earnings in this area tend to be influenced by market levels (which affect client asset values) and net client flows. 4) Capital markets revenue: RBC generates revenue from underwriting and advisory services (investment banking fees), sales and trading, market making, financing, and other capital markets activities. This includes client-driven trading and related revenue, as well as gains/losses from certain market exposures; performance is influenced by market volatility, client activity, and deal volumes. 5) Insurance premiums and investment income: RBC earns money from insurance by collecting premiums (net of claims and policy benefits) and from investment income on the assets held to support insurance liabilities. Results are influenced by claims experience, policy lapses, pricing, and investment returns. 6) Investor and custody services: Through investor services activities, RBC earns fees for custody, fund services, trade settlement, and other institutional client services; revenue depends on client assets, transaction volumes, and service mandates. 7) Other income and factors: Additional earnings can come from foreign exchange and treasury activities, dividends on certain investments, and gains/losses on securities measured at fair value, depending on accounting classification. Overall profitability is also affected by operating expenses, regulatory capital and liquidity requirements, funding costs, and macroeconomic conditions (which influence loan demand and credit quality).

    Company Guidance

    Management’s 2026 guidance highlighted mid‑single‑digit growth in all‑bank net interest income (ex‑trading), with the bulk of the remaining $80m PPA accretion rolling off next quarter (≈ a 4‑bp headwind to Canadian banking NIM); all‑bank NIM was down 7 bps QoQ (ex‑trading NIM +1 bp QoQ) and Canadian banking NIM would have been ~+2 bps excluding the PPA effect. They reiterated low‑ to mid‑single‑digit mortgage growth and commercial loan growth nearer the lower end of mid‑ to high‑single‑digits, expect all‑bank expense growth in the mid‑single‑digit range while still delivering positive all‑bank operating leverage (1–2% for Canadian Banking), see the adjusted non‑TEB effective tax rate moving toward the higher end of the 21–23% band over the next 12 months, expect corporate support losses to trend to the lower end of $100–150m/quarter, foresee a modest ~10‑bp negative CET1 impact next quarter from retail capital parameter changes, and reiterated that full‑year 2026 provisions on impaired loans should remain within prior guidance; they also noted roughly $1bn annual technology/safety spend and continued capital returns (Q1 buybacks ≈4.2m shares / ~$1bn).

    Royal Bank Of Canada (RY) Dividend Data:

    NOTE:

    • Royal Bank Of Canada’s (RY) Moving Averages Convergence Divergence (MACD) indicator is 3.19, suggesting Royal Bank Of Canada is a Sell.
    • Royal Bank Of Canada’s (RY) 20-Day exponential moving average is 230.20, while Royal Bank Of Canada’s (RY) share price is C$240.35, making it a Buy.
    • Royal Bank Of Canada’s (RY) 50-Day exponential moving average is 228.14, while Royal Bank Of Canada’s (RY) share price is C$240.35, making it a Buy.

    RY.TO’s 12-month analyst range is roughly C$203 to C$227, with a consensus around C$211.5 in one major source and C$206.6 in another; both imply only modest upside from recent prices.

    What that means

    • Base case: low-to-mid single-digit upside over 12 months.
    • Bull case: toward C$227 if earnings stay strong and the market keeps paying a multiple premium.
    • Bear case: low C$200s if credit costs rise or the sector de-rates.

    Why the range is tight

    Analysts are split between “quality compounder” and “fully valued bank” because RBC just posted strong Q1 results, but the stock already reflects much of that strength.

    The main debate is whether record earnings and wealth/capital-markets strength justify further multiple expansion, or whether rising impaired loans and integration/capital considerations limit upside.

    Practical takeaway

    For a 12-month horizon, RY looks like a steady hold rather than a big rerating story unless the next few quarters show continued earnings beats without a credit wobble.

    Key risks

    Credit losses rise faster than expected. RBC’s Q1 strength came with rising impaired loans and ongoing normalization in provisions, so a weaker economy would hit earnings and the multiple.

    Canadian slowdown / housing stress. RBC is heavily exposed to Canadian consumers and mortgages, so softer GDP, higher unemployment, or a housing correction would pressure loan growth and credit quality.

    Multiple already rich. Analysts already describe RBC as close to fair value or fully valued, so even good earnings may not drive much upside if the market de-rates banks.

    Capital markets cyclicality. RBC’s strong wealth and trading income can fade quickly if market activity cools, reducing a big support for recent earnings strength.

    HSBC Canada integration / execution. The acquisition helps scale, but integration and cost synergies must keep delivering to justify the premium valuation.

    What matters most

    RY’s 12-month target is most vulnerable to higher credit provisions and a valuation reset, not to a collapse in earnings.

    For valuation, this suggests RY.TO’s credit-loss risk is more about timing and magnitude than a permanent step-change in credit quality. If the economy stays soft, provisions can stay elevated; if conditions stabilize, they can move back down toward more normal levels.

    END

    Reference: March 11, 2026 Royal Bank of Canada .docx