Author: Consultant

  • Canadian Tire Corp (CTC-A.TO):

    Summary

    • CTC.A.TO rose strongly over the past 10 trading days, from C$186.31 on June 15 to C$194.99 on June 26: +C$8.68 / +4.7%.
    • The move was concentrated in the last three sessions: June 23–25 added C$10.61, before a small pullback on June 26.
    • The main driver was likely renewed confidence in Canadian Tire’s Q1 results and consumer resilience, not broad TSX strength.
    • Q1 showed revenue +3.3%, retail revenue +2.9%, and EPS of C$2.02, but comparable sales were still down 1.0%, so the rally was selective rather than risk-free.
    • The stock is now closer to its 52-week high of C$202.46, leaving less margin for disappointment.

    Data & Evidence

    DateCloseDaily Move
    Jun 15C$186.31-0.25%
    Jun 16C$185.94-0.20%
    Jun 17C$186.05+0.06%
    Jun 18C$186.64+0.32%
    Jun 19C$186.09-0.29%
    Jun 22C$185.15-0.51%
    Jun 23C$187.55+1.30%
    Jun 24C$190.46+1.55%
    Jun 25C$195.76+2.78%
    Jun 26C$194.99-0.39%

    10-day change: C$186.31 → C$194.99 = +C$8.68 / +4.7%.

    Key Drivers

    1. Macro: consumer discretionary improved, but not broadly

    CTC.A moved higher even though the TSX had mixed days during the same window. The TSX fell on June 23 and June 24 due to weaker commodities and tech pressure, while CTC.A rose on both days. That suggests the move was stock-specific or sector-specific, not just index beta.

    2. Sector: investors rewarded resilient Canadian consumer exposure

    Canadian Tire’s Q1 release described consumers as “resilient but selective”, with value still important. That matters because CTC.A is a household, auto, sporting goods, apparel, and financial-services consumer name.

    3. Company: Q1 was good enough to support rerating

    Key Q1 figures:

    MetricQ1 2026 ResultInterpretation
    Consolidated revenueC$3.57B, +3.3% YoYPositive
    Retail revenue+2.9% YoYPositive
    Retail revenue ex-petroleum+5.0% YoYStronger underlying retail
    Consolidated comparable sales-1.0%Still soft
    CTR comparable sales-2.3%Weak core banner
    SportChek comparable sales+3.3%Positive
    Mark’s comparable sales+1.2%Positive
    Diluted EPSC$2.02 vs C$0.67Big headline improvement
    Quarterly dividendC$1.80/shareIncome support

    Source: Canadian Tire Q1 2026 results.

    Valuation Logic

    The price move looks like a short-term rerating after the market digested Q1 results. Investors appear to have focused on:

    PositiveNegative
    Revenue growth resumedComparable sales still negative
    EPS improved sharply vs last yearCore CTR comps down 2.3%
    SportChek and Mark’s positive compsConsumer remains value-sensitive
    Dividend yield still supportiveStock is approaching 52-week high

    At C$194.99, the stock is about 3.7% below its 52-week high of C$202.46. That means upside now depends on evidence that Q2 spring/summer demand is converting into stronger comparable sales, not only inventory shipments.

    Risks

    • Core Canadian Tire Retail weakness: CTR comparable sales were down 2.3% in Q1.
    • Consumer selectivity: value-seeking behaviour can pressure margins.
    • Seasonality risk: Q2 matters because spring/summer categories need to sell through, not just ship to stores.
    • Technical risk: after a fast move from C$185.15 to C$195.76, short-term profit-taking is normal.

    Scenarios

    ScenarioWhat happens nextPrice implication
    BullQ2 demand improves, CTR comps turn positive, margin holdsRetest C$202–203
    BaseRevenue stable, but comps mixedRange around C$190–198
    BearSpring/summer sell-through disappoints or margins weakenPullback toward C$186–190

    Actionable Takeaways

    CTC.A.TO’s 10-day move was a bullish rerating, concentrated after June 22. The market rewarded resilient revenue, strong EPS optics, and dividend support, while looking through weak comparable sales. The key confirmation is whether the stock can hold above C$190 and whether upcoming results show improvement in CTR comparable sales.

  • Linamar Corp (LNR.TO)

    Summary

    • LNR.TO declined over the past 10 trading days, from C$102.89 on June 15 to C$98.67 on June 26, a drop of C$4.22 / -4.1%.
    • The stock peaked near C$105.21 intraday on June 22, then sold off into June 26.
    • This looks like profit-taking after a strong May/early-June rally, not a fundamental breakdown.
    • Company fundamentals remain solid: Q1 2026 sales rose 16.1% to C$2.94B, normalized EPS rose 18.8% to C$3.28, and free cash flow was C$218.6M.
    • Main concern: tariff and margin uncertainty, especially in Industrial, while Mobility remains the stronger segment.

    Data & Evidence

    DateCloseDaily Move
    Jun 15C$102.89-0.07%
    Jun 16C$102.50-0.38%
    Jun 17C$100.73-1.73%
    Jun 18C$100.34-0.39%
    Jun 19C$102.46+2.11%
    Jun 22C$102.45-0.01%
    Jun 23C$101.13-1.29%
    Jun 24C$100.52-0.60%
    Jun 25C$100.19-0.33%
    Jun 26C$98.67-1.52%

    10-day change: C$102.89 → C$98.67 = -C$4.22 / -4.1%.

    Key Drivers

    1. Macro: auto and industrial cyclicals cooled

    Linamar is exposed to Mobility, industrial equipment, agriculture, and access equipment. When investors become cautious on cyclicals, LNR often weakens even if company results are strong.

    The move was consistent with a rotation away from recent winners rather than a direct earnings shock.

    2. Sector: tariff uncertainty remains a valuation cap

    Linamar said it was maintaining FY2026 guidance after reviewing Section 232 tariff changes, but also noted that some Industrial products were seeing a more pronounced impact than under the previous tariff regime.

    That matters because the stock had already rallied strongly. When a cyclical stock is near recent highs, tariff uncertainty can trigger profit-taking.

    3. Company: strong Q1, but expectations already high

    Q1 was strong:

    MetricQ1 2026 Result
    SalesC$2.94B, +16.1% YoY
    Normalized EPSC$3.28, +18.8% YoY
    Normalized net earningsC$195.8M, +17.1% YoY
    Free cash flowC$218.6M
    Mobility salesC$2.26B, +19.2% YoY
    Mobility normalized operating earningsC$183.5M, +46.3% YoY

    Source: Linamar Q1 2026 release.

    The issue is not weak results. The issue is that the stock had already priced in a lot of good news by trading above C$100.

    Valuation Logic

    LNR’s 10-day decline looks like a valuation reset after a strong run.

    The market appears to be saying:

    FactorMarket Interpretation
    Strong Mobility growthSupports the stock
    Positive free cash flowSupports valuation
    Tariff uncertaintyCaps upside
    Industrial margin pressureCreates caution
    Stock near recent highsEncourages profit-taking

    The important level is C$100. LNR slipped below that level on June 26, which weakens short-term momentum.

    Risks

    • Tariff costs could reduce margins if not fully passed through.
    • Industrial segment weakness could offset Mobility strength.
    • Auto production softness would pressure volumes.
    • Profit-taking risk remains because the stock recently traded near C$105–107.

    Scenarios

    ScenarioWhat happensPrice implication
    BullTariff risk eases, Mobility momentum continues, Industrial stabilizesReclaim C$102–105
    BaseStrong fundamentals, but investors remain cautious on cyclicalsRange around C$98–102
    BearTariff costs rise or Industrial margins disappointBreak below C$98, possible move toward C$95

    Actionable Takeaways

    LNR.TO’s past 10-day decline was mainly profit-taking and cyclical caution, not a collapse in fundamentals. The company’s Q1 results were strong, but the stock had already moved up sharply, so tariff and margin concerns were enough to pull it back below C$100.

  • Magna International  Inc (MG.TO):

    Summary

    • MG.TO fell modestly over the last 10 trading sessions, from C$93.21 on June 12 to C$91.49 on June 26, a decline of about -1.8%.
    • The stock traded in a wide but contained range: roughly C$90.27–C$95.58, showing volatility but no clear breakdown.
    • The main driver was likely auto-sector uncertainty, especially tariffs, global vehicle production weakness, and EV program changes.
    • Company fundamentals were better than the share move suggests: Q1 2026 sales rose 3% to US$10.4B, and adjusted EPS was US$1.38, above estimates.
    • The stock is still up sharply over 12 months, but short-term momentum has cooled near the C$90–96 trading band.

    Data & Evidence

    DateCloseDaily Move
    Jun 12C$93.21+1.69%
    Jun 15C$93.83+0.67%
    Jun 16C$91.71-2.26%
    Jun 17C$91.71flat
    Jun 18C$92.34+0.69%
    Jun 19C$91.94-0.43%
    Jun 22C$93.46+1.65%
    Jun 23C$91.59-2.00%
    Jun 24C$91.20-0.43%
    Jun 25C$92.60+1.54%
    Jun 26C$91.49-1.20%

    Source: StockAnalysis historical prices.

    Key Drivers

    1. Macro: tariff and trade uncertainty

    Magna is highly exposed to North American auto supply chains. Recent commentary around tariffs remains important because auto parts cross borders multiple times before final assembly. Reuters reported that Magna flagged tariff costs in Q1 and slightly reduced its full-year sales outlook to US$41.5B–US$43.1B, down from US$41.9B–US$43.5B.

    That explains why the stock did not continue sharply higher despite strong Q1 results.

    2. Sector: autos remain cyclical

    Magna’s Q1 came against a weak production backdrop. Reuters noted that global light vehicle production declined 7%, which is a headwind for auto suppliers even when company execution is strong.

    This matters because Magna’s revenue is tied to vehicle production volumes, model mix, and OEM program launches.

    3. Company: strong earnings, but guidance caution

    The positive side: Magna beat expectations. Q1 sales rose about 3% to US$10.4B, and adjusted EPS of US$1.38 beat the US$1.01 estimate.

    The negative side: management’s sales guidance cut and tariff commentary kept investors cautious. That combination usually creates a range-bound stock reaction: strong numbers support the floor, but macro uncertainty caps upside.

    Valuation Logic

    MG.TO’s current valuation is not extremely cheap on trailing earnings. StockAnalysis lists a P/E of about 27.5x, but a much lower forward P/E of about 9.6x, implying investors expect earnings recovery.

    That creates a split setup:

    Valuation lensInterpretation
    Trailing P/ELooks expensive because recent earnings were depressed
    Forward P/ELooks more reasonable if margin recovery continues
    Price targetAverage analyst target near C$92.44, close to current price
    Market messageUpside is no longer obvious after the strong 12-month rally

    Risks

    • Tariff escalation would pressure margins and customer demand.
    • Lower global auto production would reduce Magna’s revenue base.
    • EV program delays or cancellations can affect future growth assumptions.
    • Stock already recovered strongly over 12 months, so near-term upside requires new evidence, not just valuation re-rating.

    Scenarios

    ScenarioWhat would happenPrice implication
    BullTariff risk eases, auto production stabilizes, Q2 confirms margin recoveryRetest of C$95–96
    BaseGood execution but tariff and production uncertainty remainRange-bound around C$90–94
    BearTariffs worsen or Q2 guidance weakensBreak below C$90, likely toward mid/high C$80s

    Actionable Takeaways

    MG.TO’s past 10-day move was not a company-specific collapse. It was a modest pullback inside a volatile trading range, driven by tariff uncertainty and auto-cycle caution despite solid Q1 execution. The key confirmation point is whether the stock can reclaim the C$95–96 area; the key downside level is C$90.

  • Just how much trouble is Canada’s economy in?

    Prime Minister Mark Carney has promised to reboot Canada’s economy, building it into the “strongest in the G7”.

    He has spent weeks travelling overseas in the last year seeking to drum up business interest in Canada as an investment destination.

    But there is no doubt the country’s economy is struggling, and from tariffs on certain industries to younger Canadians struggling to find work or buy a home, some Canadians are feeling the pain more than others.

    1. Technical recession – but it could be worse

    Economic growth in Canada this year is forecast to be 1.6%, according to the International Monetary Fund (IMF). That’s behind the US but ahead of European G7 partners.

    As the country’s economy recovers from the slowdown triggered by US tariffs, the Organisation of Economic Co-operation and Development (OECD), an influential global policy group, projects a modest improvement in gross domestic product (GDP) – growth of 1.7% – in 2027.

    Earlier this month, the country’s statistics agency said Canada had slipped into a technical recession – two consecutive quarters of GDP decline, in late 2025 and early 2026. Economists cautioned against panic, saying the country is likely to avoid a prolonged downturn.

    “Whether one chooses to divine the fact that we’re in a recession or not really does miss the point,” said Jeremy Kronick, president of the CD Howe Institute, a non-partisan economic think tank.

    2. Rising inflation and pocket book pain

    For many Canadians, the cost of living is a major worry.

    Some 61% of respondents told the non-profit Angus Reid Institute research firm in a recent poll that it was their top concern, ahead of housing affordability, crime and US tariffs.

    Inflation in May was 3.2%, up from 2.8% in April, driven by higher energy prices, notably gasoline prices due to the fallout from the Iran war. That’s still down from the post-pandemic highs of 7% or 8% in the summer of 2022.

    It’s a pattern repeated across most other wealthy nations, with Canada’s inflation rate similar to those in major European economies but still lower than in the US.

    “It is clear that inflation does cause hurt for a range of people, and that the majority of us see that inflation as we go to a grocery store, we see our energy prices inflate,” said Paul Kershaw, founder of the generational fairness advocacy group Generation Squeeze, and a professor at the University of British Columbia.

    3. More equity for some, higher debt for others

    Kershaw called rising housing costs a “third kind of inflation” – one which has led to a boom in equity for current homeowners but has left many, mostly younger people, out of the market.

    Kershaw said there are “Canadians who are doing just fine, who’ve actually probably gained wealth over some of these harder years… and who are managing the frustrations that come with higher food costs and higher energy costs.”

    Canadian households now carry the largest debt burden among G7 nations. Much of it is driven by mortgage debt, which analysts argue helps increase net worth, while the rest is consumer credit and other loans.

    The recent Angus Reid survey indicates that seven-in-10 Canadians describe their current household finances as “good” or “very good”, while the 27% who say they are in poor financial shape are also more pessimistic overall about their financial future.

    A separate survey from the firm suggests more than a third of Canadians say the financial aspect of their current living situation is tough or very difficult. That rises to 45% among renters. People who have secured a home and a mortgage whose households make less than C$100,000 (£53,400) are also under financial pressure.

    4. Many younger Canadians are struggling

    Canada’s unemployment ‌stood at 6.6% in May, while youth unemployment is at 13.4% – the first decline since January but still stubbornly higher than pre-pandemic averages of about 10%.

    Kershaw added: “We are at a moment where the economy disproportionately isn’t working for younger people, and some newcomers of any age.”

    He argues that Carney’s plans to make the economy more productive and resilient, which comes with significant investments in infrastructure projects and defence spending, won’t help the many Canadians just trying to make ends meet now.

    Carney has acknowledged affordability challenges, most recently offering a one-time grocery benefits payment to eligible Canadians.

    But the prime minister has repeatedly urged patience.

    “This government’s been in the process of laying the foundations for a stronger, more resilient, more independent Canadian economy,” Carney said earlier this month.

    “That process is settling in during that time as the major investments, major changes to how the government operates, how we do major projects, how we have new trade agreements with other countries.”

    His Liberal government has plans to, among other actions, double Canada’s non-US exports over the next decade by expanding trade relationships across Europe and Asia, and to fast track major infrastructure projects.

    Dave McKay, CEO of the Royal Bank of Canada, the country’s largest bank, cautioned during a talk hosted by Bloomberg earlier this month that the clock is ticking.

    “We have to see tangible progress on a couple of these big ideas,” he said. “The capital is impatient, and it will move where it thinks they can get the most sure and fastest return.”

    Kronick, of the CD Howe Institute, said uncertainty with Canada’s largest trading partner, the US, is another headwind.

    5. Canada still depends on US trade – and Trump

    For James White, the US-Canada trade war has had a major impact on his family-owned company, Wellmaster.

    The Ontario-based firm manufactures products for drillers, and White, the firm’s president and CEO, said 60% of its profitability is reliant on access to the US market.

    But since the tit-for-tat tariffs began last year between the two trading partners, sales are down by 20%. His business has been affected by US levies on steel derivatives – and Canada’s similar retaliatory tariffs.

    “I’m being pulled down in my ability to make investments in my people and my technology and my equipment. That’s not happening with my competitors,” he said.

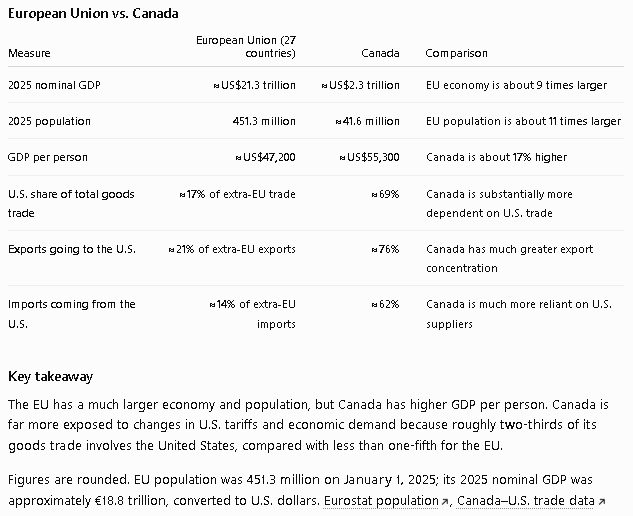
    US tariffs hit Canada slightly differently compared with other nations, as the country shares a border with the largest economy in the world. More than 70% of Canadian exports head to the US, and the economies are deeply integrated.

    While the majority of products are exempt from US tariffs under the current free trade agreement between the US, Canada and Mexico – the USMCA – the White House has imposed tariffs on specific sectors, including 15% to 50% tariffs on steel, aluminum, and copper – the ones proving challenging to White – and 25% tariffs on vehicles.

    “What’s key is just that there are these different parts of the economy or the country that are affected differently,” said Kronick.

    “We’ve seen big changes in [auto hubs] Brampton and Windsor and changes where steel, aluminum, and autos are all impacted. I think they’re experiencing it far more acutely than, perhaps, people in downtown Toronto.”

    Ottawa is negotiating with the US both to reduce these sectoral tariffs and on a review of the USMCA but have yet to reach a deal.

    “I think at this point most people expect there to be some tariffs on whatever a deal looks like, but I think what’s necessary now is just to know what that is, right?,” Kronick said.

    “If I know it’s 10% fine, it’s a 10% tax, and I can make my adjustments to my business accordingly, and we move on,” he said.

    Kronick said Canada’s economy has some structural issues feeding the stagnation, such as trade barriers between provinces – things like different trucking requirements, or professional licensing – and a tax system that has become “uncompetitive, let’s just say with, with other jurisdictions that we compete with”.

    But there are some fundamental strengths.

    “If you were drawing up a country from scratch, a well-educated, well-resourced, not overpopulated country would be what you would want, right? So, I think Canada has all those things, all those features,” he said.

    “I think we just have to unlock them.”

    With files from Nadine Yousif

  • Consumer Discretionary Index ($TTCD)

    Executive Summary: Past 10 Days

    • TTCD has been rising, not falling: latest quoted level was 411.22, up +0.31% on the day, with a 52-week high of 423.67.
    • Exact 10-trading-day return was not available from the accessible data, but Barchart shows +1.12% over 5 days and +3.04% over 20 days, so the 10-day move likely sits between those unless there was a sharp single-day reversal.
    • The move appears driven by large constituents, especially Dollarama, Restaurant Brands, Magna, Aritzia, and Canadian Tire, which TMX lists among TTCD’s major holdings.
    • Aritzia has been a major positive fundamental driver: Q4 fiscal 2026 revenue rose 32.6% YoY, comparable sales rose 27.7%, and U.S. revenue rose 37.8%.
    • The index is still below its recent high: 411.22 vs 423.67, about 2.9% below the 52-week high.

    Key Drivers

    1. Consumer discretionary sentiment improved

    TTCD benefits when investors become more comfortable with Canadian consumer spending, retail earnings, and rate-sensitive cyclicals. The recent move looks like a risk-on / consumer resilience trade, rather than a defensive sector rotation.

    2. Aritzia strength helped sentiment

    Aritzia’s latest reported quarter was very strong: net revenue +32.6% YoY, comparable sales +27.7%, digital revenue +29.2%, and U.S. revenue +37.8%. That supports the view that higher-quality discretionary retailers can still grow despite tariff and consumer pressure.

    3. Canadian Tire showed “resilient but selective” consumer behaviour

    Canadian Tire’s Q1 showed revenue +3.3%, retail revenue +2.9%, and EPS of C$2.02 versus C$0.67 a year earlier, but comparable sales were still down 1.0%. That is mixed: supportive for earnings quality, but not a broad spending boom.

    4. Technical position is constructive but not overextended

    MeasureReadingInterpretation
    Last price411.22Near upper range
    5-day change+1.12%Short-term upward momentum
    20-day change+3.04%Broader 1-month recovery
    9-day RSI59.73Positive, not extreme
    14-day RSI58.43Momentum supportive, not overbought
    9-day ATR1.55%Normal short-term volatility

    Source: Barchart technical table.

    Interpretation

    TTCD’s recent strength looks like a controlled advance, not a blow-off rally. The index is above its short-term moving average and showing positive 5-day and 20-day performance, but RSI near 58–60 suggests momentum is healthy rather than stretched.

    The main reason: investors are rewarding selective consumer strength. Aritzia is showing exceptional growth, Canadian Tire is showing resilience but mixed same-store sales, and larger holdings like Dollarama and Restaurant Brands add quality/defensive-growth characteristics inside a discretionary index.

    Risks

    • Tariffs / input costs: Aritzia itself flagged tariff impact and de minimis changes, even while margins improved.
    • Consumer slowdown: Canadian Tire’s comparable sales decline shows consumers remain selective.
    • Auto exposure: Magna adds cyclical and tariff-sensitive auto exposure to TTCD.
    • Index near resistance: TTCD is still below the 423.67 high; failure near that level would suggest the rally is losing breadth.

    Scenarios

    ScenarioWhat happens nextTTCD implication
    BullRetail earnings stay strong, rates ease, consumer spending holdsRetest of 423–424 area
    BaseMixed earnings, selective spending, no major macro shockRange trade around 405–415
    BearConsumer data weakens, tariffs pressure margins, auto stocks lagPullback toward 399–405 support zone

    Actionable Takeaways

    TTCD’s past 10-day movement is best explained as positive sector rotation into higher-quality consumer names, supported by strong Aritzia results and resilient Canadian Tire data. The short-term trend is constructive, but the index is close enough to its recent high that confirmation requires a move above the 423–424 zone.

  • June 26/26: TSX ends higher as gold mining shares rally

    Canada’s main stock index rose on Friday as higher ⁠gold prices ​boosted metal mining shares, but gains for the index were kept in check as investors worried about the inflationary impact of the AI boom. Wall Street ended mixed.

    The Toronto Stock Exchange’s S&P/TSX Composite Index ended up 129.79 ​points, or 0.4%, at 34,980.00. For ‌the week, the index added 0.4%.

    The materials sector, ⁠which includes metal miners, was up 1%. It was the ⁠second straight day of gains for the sector after it traded near the ​bottom of its range this year on Wednesday.

    The price of gold rose 1% as the U.S. dollar gave back some of its recent gains.

    Technology added 1.2%, with shares of e-commerce company Shopify Inc adding 4.6%. Industrials were up 0.7%, while real estate ended 1.6% higher. The two most heavily ⁠weighted sectors edged lower. Financials lost 0.2% ​and energy was down 0.3%.

    The price of oil settled 3.7% ⁠lower at $69.23 a barrel, adding to its steep weekly decline, as as oil tankers kept exiting the ‌Strait of Hormuz, easing supply concerns.

    The TSX was headed for ​a 6.8% gain in the second quarter, which would be its eighth straight quarterly advance.

    Domestic data was downbeat, with a preliminary report showing that wholesale trade fell 0.7% in May ​from April.

    On Wall Street, the S&P 500 ended marginally lower, with a steep drop in AI-related chip stocks and sharp gains in Moderna and other healthcare stocks.

    The PHLX chip index tumbled 5.3%, underscoring recent volatility among AI-related chipmakers that have fueled ⁠much of Wall ​Street’s gains in recent years. While some investors remain optimistic about the potential for AI to fuel higher profits, others worry that massive spending to build AI data centers may take too long to pay off.

    “It’s too early to conclude that there’s a major correction brewing in tech, but what I would say is ​that the questions around profitability and the capex story are certainly not ‌going away,” said David Stubbs, chief investment strategist at AlphaCore Wealth Advisory.

    Stubbs also warned that Wall Street could be vulnerable to signs that U.S. companies may not be able to deliver on investors’ high earnings expectations. Apple rallied 3.1% and partly rebounded from a selloff on Thursday, when it raised iPad and MacBook prices, blaming soaring memory and storage chip costs.

    Moderna surged almost 13% to ‌its highest level since ​2024 after the drug developer ‌hosted an investor event and showcased its pipeline.

    Eight of the 11 S&P 500 sector indexes declined, led lower by ​industrials, down 3.41%, followed by a 2.45% loss in materials. U.S. inflation rose ⁠above 4% in May, data showed on Thursday, as the Iran war drove up energy ⁠prices, keeping alive the possibility of a Fed rate hike.

    While oil prices have retreated sharply as the Middle East tensions eased, Apple’s newly ​announced price hikes suggest inflation remains a concern, said Art Hogan, chief market strategist at B. Riley Wealth.

    “We saw a similar dynamic during the pandemic, when supply chain disruptions limited access to semiconductors. Now, we’re witnessing a comparable supply shock, this time driven by memory, which is creating renewed inflationary pressure,” Hogan said.

    The S&P 500 declined 0.05% to end the session at 7,353.95 points. The Nasdaq declined 0.24% ⁠to 25,297.62 points, while the Dow Jones Industrial Average declined 0.09% to 51,876.11 points.

    For the week, the S&P 500 fell 2.05% and the Nasdaq lost 4.7%.

    The chip index lost 7.9% for the week, its worst week since early April. A report that OpenAI was considering delaying its public debut until next year also weighed on risk sentiment related to AI stocks.

    Shares of SpaceX edged up 0.15%. Passively managed index funds need to buy billions of dollars’ ⁠worth of the stock ahead of its inclusion in Russell indexes.

    Meanwhile, interest ​rate concerns persisted, with traders pricing in one 25 basis-point rate hike and a near 27% chance of another by ⁠year-end, according to LSEG-compiled data.

    A survey showed U.S. consumer sentiment rebounded from record lows in June, though households remained worried about the high cost of ‌living.

    ON Semiconductor dropped almost 24% after agreeing to acquire Synaptics in an all-stock deal valued at about $7 billion. Synaptics dipped ​3.7%.

    Advancing issues outnumbered falling ones within the S&P 500 by a 1.8-to-one ratio. The S&P 500 posted 35 new highs and 5 new lows; the Nasdaq recorded 263 new highs and 169 new lows. Volume on U.S. exchanges was relatively heavy, with 30.1 billion shares traded, compared with an average of 23.1 ​billion shares over the previous 20 sessions.

    Reuters, Globe staff

  • Exhibit on displaced Palestinians set to open at human rights museum amid criticism

    WINNIPEG – The head of the Canadian Museum for Human Rights says it’s unfortunate a trustee resigned over an exhibit about displaced Palestinians but she stands by the decision for it to open to the public Saturday.

    The exhibit, titled “Palestine Uprooted: Nakba Past and Present,” focuses on people affected by the Nakba, Arabic for catastrophe. About 750,000 Palestinians were forcibly displaced in 1948 during fighting over control of what is now Israel.

    The exhibit has been in the works for four years, though Palestinian Canadians have been calling for their stories to be told at the Winnipeg museum since it opened in 2014.

    Jewish groups have raised concerns that the exhibit could fuel antisemitism by not providing more historical context and that it was created without sufficient consultation and transparency.

    Board member Mark Berlin submitted his resignation earlier this week, accusing the museum of putting forth ideology instead of an accurate history.

    “It’s unfortunate that (Berlin) chose to resign based on his opinions about this exhibit and what he knew of it,” Isha Khan, the museum’s chief executive officer, said Friday.

    “Board governance is intended to manage different opinions and make decisions that are from the best interests of this museum and to ensure that we deliver our mandate. I believe that’s what our board has done — supported this museum to do the work to deliver our mandate.”

    Berlin, who hadn’t seen the exhibit before resigning, said it didn’t acknowledge the estimated 850,000 Jewish people who were forced to flee Arab countries in the years following the establishment of Israel.

    He said presenting the Palestinian displacement of 1948 without proper historical and political context can deepen the distrust and animosity that exist between Jews and Muslims in Canada. 

    Khan said stories of Palestinian Canadians have been underrepresented in the museum’s galleries.

    She said she has heard criticism from people and groups who haven’t yet seen the Nakba exhibit and challenged them to view it with compassion and empathy. 

    “Sharing the experiences of one community doesn’t diminish or negate the experience of another,”

    Khan said the museum has committed to telling stories about Jewish displacement in the future. And she encouraged those critical of the exhibit to step into the space first. 

    “Then we can have some constructive discussion about what it is and what their concerns might be. To this point, many of those concerns were based on what it could be and fear.”

    The museum invited media to view the exhibit Friday.

    Taking up about 12 metres of an existing gallery, it includes video testimonies, photographs, art and writings. Property deeds, house keys and deep red embroidered clothing are also among featured artifacts.

    Short videos on a small screen share first-hand accounts of Palestinian Canadians displaced in 1948.

    Isabelle Masson, curator of the exhibit, spoke with about 10 Palestinian Canadians in Winnipeg and Montreal for the project. 

    She said their stories helped the team understand the historical impacts of displacement and highlighted the hope of Palestinians.   

    “The exhibition holds stories about this intergenerational trauma, about loss and uprooting, but also stories about beauty, cultural practice and art.”

    Fouad Sahyoun was four when his family was displaced from Haifa in what is now known as Israel. He settled in Canada in 1990. 

    Portions of an interview with the 82-year-old are featured. He talks about how his grandfather’s properties were seized, along with the family’s cars, bank accounts and furniture. 

    In an interview with The Canadian Press, The 82-year-old said he dreams of one day returning to Haifa as a Palestinian citizen.

    “We live under trauma, and that trauma will only end when we’re allowed to go back as decent people, as human people, in our homes and properties.”

    Sahyoun hopes the exhibit educates others to, “know our story, know what we went through.”

    This report by The Canadian Press was first published June 26, 2026.

    Oct. 7: Hamas terrorists burst through border, slaughter Israelis in their homes

    At least 300 killed, 1,590 injured, hostages taken in multi-pronged infiltration from Gaza, as terrorists attack civilians, soldiers at 22 sites; thousands of rockets fired at Israel

  • RBC fined more than $4-million for providing inaccurate credit card statements

    Canada’s financial consumer watchdog says the Royal Bank of Canada RY-T -0.81%decrease was fined more than $4-million for providing inaccurate credit card statements to some customers.

    The Financial Consumer Agency of Canada says it issued a fine of $4.25-million in March, which the bank paid in April.

    It says RBC provided credit card statements with wrong information about amounts credited or charged between 2001 and 2024. 

    The agency says a total of 227,947 accounts were affected and that RBC transferred and refunded more than $22.4-million. 

    Nathaniel Wallace, a spokesperson for RBC, says the lender takes its regulatory obligations seriously. 

    He says RBC self-reported the matter to the financial consumer watchdog and that RBC has fully co-operated with the regulator throughout the process. 

  • SU.TO historical share prices (6 months) with WTI prices—correlation and forecast for the next 3 months SU.TO share price based on (1) 5% WTI price increase and (2) a 5% decrease

    SU.TO (Suncor Energy) maintains a strong positive correlation with WTI crude oil prices over the past 6 months (and historically), as is typical for this major integrated Canadian oil producer with significant upstream exposure.

    Recent Historical Overview (approx. Dec 2025 – June 25, 2026)

    • SU.TO (TSX, CAD): Traded in the $50s–$60s earlier in the period, rallied strongly with oil (peaking near $90–$96 in spring/early May 2026), then declined sharply in May–June amid falling oil. Recent closes: ~$77–$80 (e.g., ~$77.49–$77.55 on June 24–25, 2026).
    • WTI (USD/bbl): Peaked higher (around $90–$100+ in spring) before declining to the ~$70–$72 range recently (e.g., front-month futures around $71–$72 on June 25, 2026).

    Both moved directionally together, with SU.TO gaining from higher realizations (and downstream refining providing some buffer) but pulling back with the recent oil weakness.

    Correlation

    • Strong positive correlation: Historical analyses (multi-year) show Pearson correlations of ~0.58–0.64 between SU and WTI/Brent, meaning oil explains a substantial portion (~34–41% via r²) of SU price variance.
    • In the recent 6-month period, the linkage remained evident in the co-movement during the spring rally and subsequent decline. Other factors (CAD/USD FX, refining margins, costs, company ops, broader markets) moderate the relationship. Suncor’s integrated model (oil sands production + refining) offers some resilience compared to pure upstream peers.

    Sensitivity Context

    • A ~US$1/bbl change in WTI can impact Suncor’s adjusted funds from operations (AFFO) by roughly $200 million annually (per older guidance; scales with production).
    • Breakeven WTI has improved significantly (low $40s in some reports), supporting resilience.

    3-Month Forecast Scenarios (from late June 2026 baseline)

    Current baselines: SU.TO ~$77–$78 CAD; WTI ~$71–$72/bbl.

    • +5% WTI scenario (~$3.55–$3.60 increase → ~$74.5–$75.6/bbl): Positive support for SU.TO. Given the correlation/sensitivity, expect ~3–8% upside (rough estimate; not 1:1 due to hedging, FX, margins, duration of move, and sentiment). This suggests a potential range of ~$80–$84 over 3 months (base case). Stronger sustained recovery + positive catalysts could push toward $85+. Analyst targets (broader 12-month) are higher, often in the $90s–$100+ CAD.
    • -5% WTI scenario (~$3.55–$3.60 decrease → ~$67.5–$68.5/bbl): Downward pressure. Similar magnitude sensitivity implies ~3–8% downside, pointing to a potential range of ~$71–$75. Deeper or prolonged weakness (below key thresholds) could pressure cash flow, buybacks, and sentiment more, though Suncor’s lower breakeven and downstream help cushion.

    Key caveats:

    1. Not linear or guaranteed: Short-term moves can overshoot; longer-term depends on production, costs, WCS differentials, refining cracks, CAD strength (currently ~1.42 USD/CAD), geopolitics, OPEC+, demand, and macro factors.
    2. Volatility is high in energy. Analyst consensus targets for SU.TO remain constructive overall but vary.
    3. Overall: Strong historical tie to WTI supports upside in the +5% case and risk in the -5% case, with Suncor’s fundamentals providing a reasonable buffer.