Executive Summary
- Highest-impact TSX driver: Middle East / Strait of Hormuz risk. Oil sensitivity affects TSX Energy, inflation expectations, CAD, and rate-cut odds. U.S. strikes on Iran followed an Iranian drone attack on a ship in the Strait of Hormuz, keeping crude risk elevated.
- Main economic event: U.S. June payrolls on Thursday, July 2. A strong jobs print would pressure rate-sensitive TSX sectors; a weak print would support bonds, utilities, REITs, and gold.
- Canada data: Canada April GDP is due Tuesday, June 30. This matters for banks, consumer discretionary, industrials, and BoC rate expectations.
- Liquidity risk: TSX is closed Wednesday, July 1 for Canada Day, while U.S. markets are closed Friday, July 3 for Independence Day observed. Expect lower volume and sharper moves around data/geopolitical headlines.
- Trade risk remains a background drag: U.S.–Canada tariff uncertainty continues to affect autos, industrials, materials, and exporters. RBC calls the trade shock a “slow leak,” not a single-day shock.
Key Drivers for TSX — Week Ending July 3, 2026
| Date | Factor | TSX Impact Channel | Sectors Most Exposed |
|---|---|---|---|
| Mon–Fri | Middle East / Strait of Hormuz | Oil up = TSX Energy support; oil spike = inflation/rate risk | Energy, pipelines, airlines, consumer |
| Tue, Jun 30 | Canada April GDP | Weak GDP = BoC cut expectations; strong GDP = less rate relief | Banks, REITs, consumer, industrials |
| Tue, Jun 30 | U.S. consumer confidence / housing | U.S. demand signal for cyclicals | Industrials, materials, discretionary |
| Wed, Jul 1 | TSX closed, Canada Day | No Canadian trading; risk can gap into Thursday | All sectors |
| Wed, Jul 1 | U.S. ADP, ISM Manufacturing | Manufacturing strength supports cyclicals but may lift yields | Materials, industrials, tech |
| Thu, Jul 2 | U.S. nonfarm payrolls | Strong jobs = higher yields; weak jobs = defensive/rate-cut bid | Banks, REITs, utilities, gold |
| Fri, Jul 3 | U.S. markets closed | Lower liquidity; TSX open but U.S. price discovery limited | All sectors |
What to Watch by Market Driver
1. Oil and Middle East risk
Bullish for TSX Energy: If WTI/Brent rises on renewed Strait of Hormuz disruption, Canadian energy names and pipelines may outperform.
Bearish for broader TSX: A sharp oil spike also lifts inflation risk, pressures consumers, and can push yields higher. That hurts REITs, utilities, consumer discretionary, and rate-sensitive growth stocks.
WTI was reported around US$69–70 after-hours following the U.S. retaliatory strike, with Brent near US$72–73. The issue is not just price level; it is volatility and shipping risk.
2. U.S. payrolls — Thursday, July 2
This is the week’s cleanest macro catalyst.
| Payroll Outcome | Likely Market Read | TSX Bias |
|---|---|---|
| Strong jobs / sticky wages | Fed stays tighter for longer | Negative for REITs, utilities, gold; mixed for banks |
| Soft jobs, not recessionary | Rate-cut expectations rise | Positive for REITs, utilities, gold, quality growth |
| Very weak jobs | Recession concern | Defensive bid; cyclicals and banks under pressure |
Consensus cited by Kiplinger was about 100,000 jobs and unemployment around 4.3% for June.
3. Canada GDP — Tuesday, June 30
Canada April GDP matters because the TSX has heavy exposure to banks, consumers, industrials, and housing-linked sectors.
| GDP Result | Read-Through |
|---|---|
| Above expectations | Supports banks/cyclicals; may reduce urgency for BoC cuts |
| Below expectations | Supports rate-cut narrative; negative for domestic growth stocks |
| Weak GDP + high oil | Worst mix: stagflation risk |
S&P Global recently described Canada as “resilient, not strong,” noting the economy stalled in Q1 2026 with real GDP down 0.1% annualized after a 1.0% annualized contraction in Q4 2025.
4. U.S.–Canada trade and tariff risk
Watch for headlines on autos, steel, aluminum, copper, lumber, and CUSMA/USMCA positioning. This is most relevant to:
| Sector / Group | Risk |
|---|---|
| Autos / parts | MG.TO, LNR.TO, suppliers exposed to U.S. demand and tariffs |
| Materials | Steel, aluminum, copper, lumber exposure |
| Industrials | Export demand, margins, supply-chain costs |
| Consumer | Higher import costs, weaker household confidence |
CFIB notes that CUSMA-compliant goods remain exempt from some tariffs, but steel, aluminum, copper, some auto parts, lumber, and wood products remain exposed under other U.S. rules.
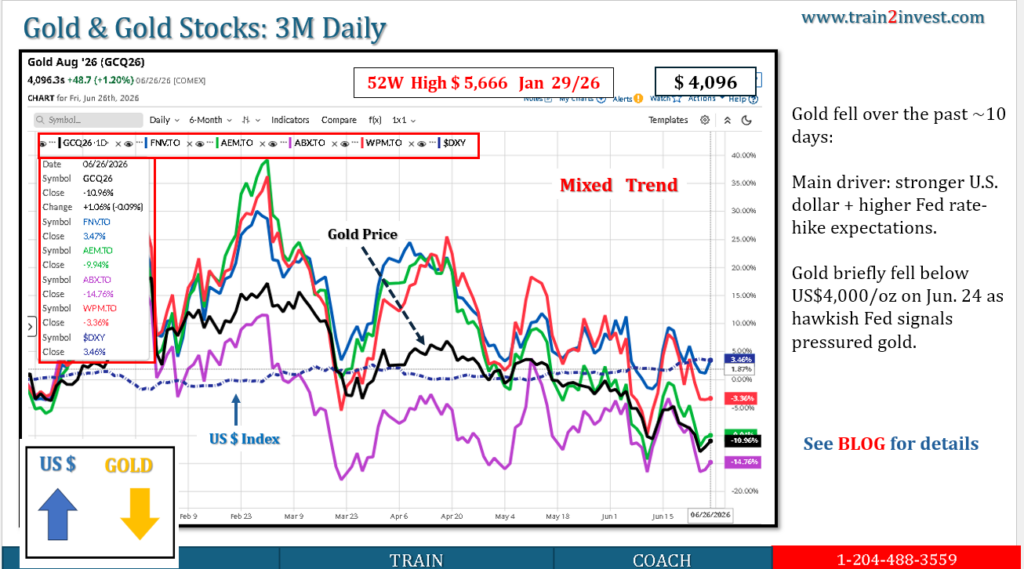
5. Gold, CAD, and rates
Gold should be watched as both a geopolitical hedge and a real-rate trade.
| Signal | TSX Read |
|---|---|
| Gold up + yields down | Positive for TSX gold miners |
| Gold up + oil up + yields up | Inflation shock; miners may rise but broader TSX weakens |
| CAD strengthens | Helps foreign investor confidence but can pressure exporters |
| CAD weakens | Supports exporters/energy translation, but may signal risk-off |
Scenarios for the Week
| Scenario | Conditions | Likely TSX Movement |
|---|---|---|
| Bull | Oil stable, U.S. payrolls soft but not recessionary, Canada GDP decent | TSX grinds higher; REITs/utilities/gold improve; banks stable |
| Base | Mixed data, oil volatile but no Strait closure | Choppy/range-bound TSX; sector rotation dominates index level |
| Bear | Iran/Hormuz escalation + strong U.S. payrolls or inflation scare | Energy may outperform, but broad TSX sells off on yield/inflation risk |
What Would Disprove the Base Case
- WTI breaks sharply higher on verified shipping disruption through Hormuz.
- U.S. payrolls are much stronger than expected, pushing yields higher.
- Canada GDP materially disappoints, increasing recession concern.
- Trade headlines hit autos, metals, lumber, or broader CUSMA-sensitive exporters.
- Gold fails to rise despite geopolitical stress, suggesting real yields/USD are dominating safe-haven demand.
Actionable Takeaways
- Watch oil first, then U.S. payrolls, then Canada GDP.
- Expect lower-liquidity trading because of the Canada Day and U.S. Independence Day observed closures.
- Energy strength may not mean the whole TSX is healthy; it could reflect geopolitical risk.
- A soft U.S. jobs report is supportive only if it does not look recessionary.
- Best risk barometer: oil + yields + CAD + gold moving together. If oil and yields rise while CAD weakens, TSX risk increases.