Category: Uncategorized

  • George Weston Limited (WN.TO):

    Executive Summary

    • WN.TO (George Weston) is ~flat to slightly down (~-1% to -2%) over 10 days
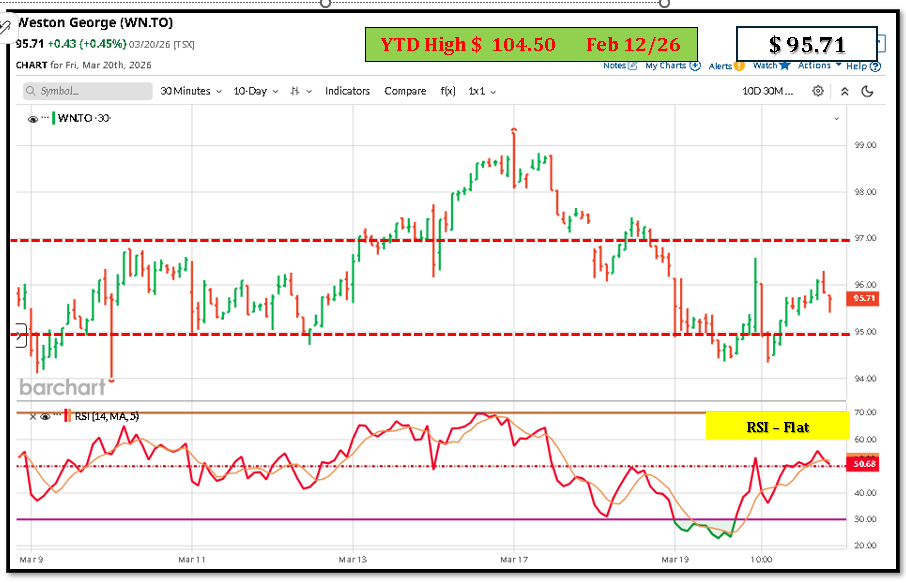
    • Price moved ~C$97 → ~C$95–96, with mild volatility
    • Primary driver: post-earnings digestion after early-March results miss
    • No sharp selloff → controlled consolidation, not distribution
    • Stock holding above key support (~C$94–95)

    Key Drivers (last 10 days)

    1) Post-earnings digestion (dominant)

    • Q4 results released Mar 4:
      • Revenue + EPS missed expectations
    • Impact:
      • No immediate collapse
      • But caps upside → sideways/down drift

    Interpretation:
    Market repricing modestly lower after disappointment, but confidence intact


    2) Mild downward drift (no catalyst)

    • Typical daily moves:
      • ~-1.0% (Mar 18)
    • Pattern:
      • Small red days, no capitulation

    Signal:

    • Sellers present, but not aggressive

    3) Technical pullback from pivot high

    • Pivot high: ~Mar 16
    • Since then:
      • ~-2.3% pullback

    Interpretation:

    • Short-term trend rolled over after rally
    • Normal mean reversion

    4) Defensive sector rotation dynamics

    • WN = grocery + REIT exposure (Loblaw + Choice Properties)
    • In current macro:
      • Rates stable/high → limits multiple expansion
    • Outcome:
      • Defensive, but no re-rating catalyst

    5) Range-bound structure

    • Support: ~C$94–95
    • Resistance: ~C$97–99

    Stock oscillating within band → consolidation phase


    Data & Evidence (recent moves)

    MetricObservation
    10-day move~-1% to -2%
    Recent price~C$95–97
    1-month trend~-3.6%
    VolatilityLow (~1–2% daily)
    PatternDrift lower → stabilize

    Valuation Logic (short-term)

    • P/E: ~35x → premium defensive multiple
    • After earnings miss:
      • Market not expanding multiple further
    • Result:
      • Price stalls despite stable fundamentals

    Risks (driving the move)

    • Earnings credibility (miss vs expectations)
    • High valuation vs growth (~9% forecast EPS growth)
    • Rate sensitivity (REIT exposure via Choice Properties)
    • Lack of near-term catalysts

    Scenarios (next 2–4 weeks)

    Bull

    • Break > C$97–98
    • Target: C$100+

    Base

    • Range: C$94–98 (most likely)

    Bear

    • Break < C$94
    • Target: C$90–92

    Actionable Takeaways

    • No event-driven selloff — this is controlled post-earnings consolidation
    • Market reaction = mild de-rating, not structural concern
    • Key signal:
      • Holding support despite earnings miss
    • Watch:
      • Loblaw same-store sales
      • real estate (Choice Properties) sensitivity to rates
  • Saputo Inc. :  (SAP.TO) 

    Executive Summary

    • SAP.TO (Saputo) is ~flat over 10 days (~-1% to 0%), but trend is mildly down then stabilizing
    • Range: C$43.16 → C$41.98 → C$42.55 (dip then partial recovery)
    • No single event-driven move; drift + minor selling pressure
    • Weakness concentrated mid-period (Mar 11–19)
    • Low volatility, no capitulation → typical defensive consolidation

    Key Drivers (last 10 days)

    1) Gradual drift lower (no catalyst)

    • Stock declined from ~C$43.1 → ~C$42.0 (-2.7%) over several sessions
    • No earnings release or major news

    Interpretation:

    • Passive selling / lack of buyers, not fundamental change

    2) Mid-period weakness (Mar 11–19)

    • Mar 11: -2.03%
    • Mar 18: -1.57%
    • Mar 19: -1.50%

    Pattern:

    • Multiple small down days → institutional distribution, not panic

    3) Late stabilization / bounce

    • Mar 20: +1.36% recovery
    • Price rebounded off ~C$41.5–42 support

    Signal:

    • Buyers active at lower band

    4) Sector-level pressure (staples)

    • Consumer staples:
      • Facing input cost pressure (dairy, logistics)
      • Limited pricing upside

    Impact:

    • Keeps upside capped → sideways price action

    5) Technical range-bound behavior

    • Resistance: ~C$43.2–43.5
    • Support: ~C$41.5–42.0

    Stock oscillating inside this band → no trend breakout


    Data & Evidence

    DateClose (C$)Change
    Mar 1042.95-0.49%
    Mar 1142.08-2.03%
    Mar 1241.90-0.43%
    Mar 1342.48+1.38%
    Mar 1643.10+1.46%
    Mar 1743.30+0.46%
    Mar 1842.62-1.57%
    Mar 1941.98-1.50%
    Mar 2042.55+1.36%

    Net: Slight decline, then recovery → range-bound


    Valuation Logic (short-term)

    • Staples trade on:
      • stability + dividend + margin visibility
    • Current issue:
      • no earnings catalyst → no multiple expansion

    Result:

    • Price anchored in tight band

    Risks (driving the move)

    • Input cost inflation (milk, energy)
    • Margin compression risk
    • Lack of growth catalysts
    • Defensive rotation fatigue (investors shifting elsewhere short-term)

    Scenarios (next 2–4 weeks)

    Bull

    • Break > C$43.5
    • Target: C$44–45

    Base

    • Range: C$41.5–43.5 (most likely)

    Bear

    • Break < C$41.5
    • Target: C$40

    Actionable Takeaways

    • No event-driven move — this is passive consolidation
    • Stock behaving like a low-beta defensive
    • Key signal:
      • Holding support despite selling pressure
    • Watch:
      • margin commentary (next earnings)
      • input cost trends
  • Alimentation Couche-Tard Inc. (ATD.TO):

    Executive Summary

    • ATD.TO fell ~-8% to -9% over the last 10 trading days (C$84 → ~C$76)
    • Single largest move: -5.1% on Mar 18 following earnings/revenue miss
    • Downtrend accelerated post-earnings + macro selloff (rates/inflation concerns)
    • Price broke short-term support (~C$80) → technical weakness
    • Move is event-driven (earnings) + macro overlay, not structural change

    Key Drivers (last 10 days)

    1) Earnings-driven selloff (primary)

    • Mar 18: -5.15% daily drop
    • Trigger:
      • Revenue miss vs expectations

    Interpretation:
    Top-line disappointment → multiple compression despite stable business model


    2) Post-earnings follow-through selling

    • Mar 19: -2.7%
    • Mar 20: additional decline
    • Total 3-day move: ~-8%

    Signal:

    • Institutional de-risking, not one-day reaction

    3) Macro pressure (TSX-wide)

    • TSX dropped ~-1.9% same day on rate/inflation concerns
    • Drivers:
      • Higher-for-longer rates narrative
      • Energy-driven inflation risk

    Impact on ATD:

    • Defensive multiple compresses when rates stay higher

    4) Breakdown of technical support

    • Pre-event range: ~C$82–84
    • Post-event:
      • Broke C$80 support
      • New range: C$75–78

    Implication:

    • Momentum shifted negative
    • Sellers in control short-term

    5) No offsetting positive catalyst

    • No:
      • Guidance upgrade
      • Margin surprise
      • Capital return news

    No reason to step in after miss


    Data & Evidence

    DateClose (C$)Change
    Mar 1684.25+1.97%
    Mar 1782.96-1.53%
    Mar 1878.69-5.15%
    Mar 1976.53-2.74%
    Mar 2076.17-0.47%

    Net move: ~-9% in 5 sessions


    Valuation Logic (short-term)

    • Pre-drop: priced for stable growth + execution premium
    • Post-drop:
      • Market repricing to reflect:
        • weaker revenue visibility
        • macro uncertainty

    Result:

    • Lower multiple, not earnings collapse

    Risks (driving the move)

    • Revenue growth sensitivity (fuel + traffic)
    • Margin variability (fuel spreads)
    • Higher rates → lower defensive multiples
    • Earnings credibility (near-term)

    Scenarios (next 2–4 weeks)

    Bull

    • Reclaim > C$80
    • Driven by:
      • earnings reassessment
    • Target: C$82–84

    Base

    • Range: C$75–80
    • Consolidation after sharp move

    Bear

    • Break < C$75
    • Driven by:
      • continued macro pressure
    • Target: C$72–73

    Actionable Takeaways

    • This is an earnings + macro-driven reset, not a structural breakdown
    • The critical shift:
      • from “stable premium compounder” → “needs confirmation”
    • Key level:
      • C$80 now resistance
    • Next catalyst:
      • margin + same-store sales trajectory next quarter
  • Alimentation Couche-Tard reports higher year-over-year profit of US$757.2M

    Alimentation Couche-Tard Inc. says its net earnings attributable to shareholders came in at US$757.2 million for the third quarter, up from US$641.4 million in the same period last year. 

    On a per diluted share basis, the company reported net earnings attributable to shareholders of 82 cents US for the quarter, compared with 68 cents US during the prior year quarter. 

    The Laval, Que.-based company, which keeps its books in U.S. dollars, says its revenue amounted to US$21.8 billion during the period ended Feb. 1, up year over year from US$20.9 billion.

    Couche-Tard says its total merchandise and service revenues reached US$5.8 billion during the quarter, rising 8.7 per cent from US$5.3 billion.   

    Chief financial officer Filipe Da Silva says the company delivered one of its best quarterly results in over two years, validating its new approach.   

    In February, Couche-Tard unveiled a new corporate strategy focused on strengthening its core platforms and pursuing targeted investment opportunities. 

    This report by The Canadian Press was first published March 17, 2026.

  • Linamar Corp (LNR.TO)

    Executive Summary

    • LNR.TO is ~flat to slightly down (~-1% to -2%) over ~10 days, with a sharp post-earnings drop followed by stabilization
    • Primary move: -7.1% on Mar 6 immediately after Q4 earnings
    • Earnings were strong (EPS beat), but selloff reflects expectations reset / profit-taking
    • Price now consolidating in C$87–C$90 range, below recent highs near C$95
    • Short-term driver: valuation + margin concerns vs strong growth narrative

    Key Drivers (last 10 days)

    1) Post-earnings selloff (dominant factor)

    • Mar 6: stock fell -7.1% in one session
    • Trigger:
      • Earnings beat (EPS 2.28 vs 1.97 expected)
      • But no upside surprise in outlook / mixed segment trends

    Interpretation:
    Market was positioned for stronger forward guidance → “good results already priced in”


    2) Segment divergence (Mobility vs Industrial)

    • Mobility (EV, driveline): strong
    • Industrial/ag: weak demand

    This creates:

    • Earnings quality concerns
    • Cyclical exposure discount

    3) Valuation compression pressure

    • P/E ~22–23x vs peers ~21x
    • Earnings trend: ~-2.5% CAGR over 5 yrs

    Implication:
    Stock re-rating risk → short-term selling after rally


    4) Prior run-up → profit taking

    • Stock near 52-week highs (~C$95) before drop
    • +60–80% YoY performance

    Typical pattern:
    Strong run → earnings → sell the news


    5) Technical breakdown then stabilization

    • Pre-drop: ~C$93–94
    • Post-drop: ~C$88–89 range
    • Current:
      • Support: ~C$87
      • Resistance: ~C$90–91

    Data & Evidence (last 5 trading days snapshot)

    Date (Mar 2026)Close (C$)Change
    Mar 688.44-7.10%
    Mar 987.21-1.39%
    Mar 1088.55+1.54%
    Mar 1189.09+0.61%
    Mar 1288.29-0.90%

    Net effect: Sharp drop → sideways consolidation


    Valuation Logic (short-term)

    • Current price: ~C$89–93
    • Consensus target: ~C$92–95
    • Implied upside: ~0–3% only

    Conclusion:

    • Limited upside → weak incentive to buy post-rally
    • Explains lack of recovery after selloff

    Risks (what drove the move)

    • Margin compression risk (2.4% net margin)
    • Industrial demand slowdown
    • High multiple vs earnings trajectory
    • Cyclical auto exposure

    Scenarios (next 1–4 weeks)

    Bull

    • Break above C$91–92
    • Driven by:
      • Analyst upgrades / EV narrative
      • Continued earnings revisions
    • Target: C$95 retest

    Base

    • Range-bound C$87–91
    • Market waits for:
      • macro data (auto production)
      • next guidance update

    Bear

    • Break below C$87
    • Driven by:
      • cyclical slowdown fears
      • margin concerns
    • Target: C$83–85

    Actionable Takeaways

    • The move is not fundamental deterioration; it is positioning + valuation reset
    • Key inflection: whether earnings growth broadens beyond mobility segment
    • Short-term behavior = post-earnings consolidation phase
    • Monitor:
      • auto production data (North America)
      • margin trajectory next quarter
      • order backlog in industrial segment
  • Dollarama Inc (DOL.TO):

    Executive Summary

    • DOL.TO is ~flat to slightly down (~-2% over 10 days)
    • Range: ~C$132 → C$129–130 → rebound toward ~C$131
    • Primary driver: post-earnings consolidation after strong prior run
    • No sharp selloff → defensive resilience vs broader retail weakness
    • Stock remains near highs → relative outperformance vs CTC, ATD

    Key Drivers (last 10 days)

    1) Post-earnings digestion (dominant)

    • Dollarama reported strong results earlier in March:
      • Continued same-store sales growth
      • Margin resilience

    Effect now:

    • No incremental upside catalyst → price stalls
    • Typical pattern:
      • Rally → earnings → sideways consolidation

    2) Defensive rotation support

    • Dollarama = counter-cyclical retail (discount)
    • Current macro:
      • Consumer weakening → benefits DOL
    • Result:
      • Buyers step in on dips → limits downside

    3) Relative strength vs peers

    • Compared to:
      • CTC.A (-7%)
      • ATD (-8–9%)

    DOL:

    • Only marginal decline (~-2%)

    Interpretation:

    • Market rotating toward defensive consumer exposure

    4) Technical consolidation near highs

    • Resistance: ~C$132–134 (recent highs)
    • Support: ~C$128–129
    • Current:
      • Holding mid-range

    Signal:

    • No breakdown → trend intact

    5) Lack of macro sensitivity

    • Unlike discretionary retail:
      • DOL benefits from:
        • trade-down behavior
    • Result:
      • insulated from rate / demand concerns (short-term)

    Data & Evidence (last 10 days pattern)

    PhasePrice Action
    Early period~C$132–133
    Mid dip~C$129
    Recent~C$130–131
    Net move~-1% to -2%
    VolatilityLow (1–2% daily)

    Valuation Logic (short-term)

    • DOL trades at premium multiple (~30x+)
    • Justification:
      • consistent growth
      • margin stability

    Current behavior:

    • No multiple expansion → sideways price action

    Risks (driving the move)

    • Valuation ceiling (already priced for execution)
    • FX sensitivity (USD sourcing)
    • Margin pressure if input costs rise
    • No near-term catalyst

    Scenarios (next 2–4 weeks)

    Bull

    • Break > C$133
    • Target: C$136–138

    Base

    • Range: C$128–133 (most likely)

    Bear

    • Break < C$128
    • Target: C$124–125

    Actionable Takeaways

    • No weakness — this is controlled consolidation at highs
    • DOL is:
      • holding gains better than peers → relative strength signal
    • Key level:
      • C$128 support critical
    • Market view:
      • still pricing DOL as top defensive retail name on TSX
  • Mar 23 RTMA: CTC-A.TO

    Executive Summary

    • CTC.A.TO declined ~-7% over the last 10 trading days (≈C$193 → C$178)
    • Trend: steady multi-day decline (no single event)
    • Largest move: -2.6% (Mar 20)
    • Pattern: consistent lower highs + lower lows → controlled downtrend
    • Driver: consumer discretionary de-risking + no catalyst, not company-specific news

    Key Drivers (last 10 days)

    1) Persistent distribution (primary)

    • Sequence:
      • Mar 6: ~C$193
      • Mar 20: ~C$178
    • Down days dominate:
      • Mar 17: -1.0%
      • Mar 18: -1.3%
      • Mar 19: -1.5%
      • Mar 20: -2.6%

    Interpretation:

    • Institutional selling over multiple sessions (not a one-off event)

    2) Breakdown from recent highs

    • Early period:
      • Peak ~C$196–197
    • Current:
      • ~C$178

    Technical shift:

    • Lower highs: 196 → 190 → 188 → 183
    • Lower lows: 190 → 186 → 183 → 178

    Clear short-term downtrend


    3) Consumer discretionary pressure

    • Canadian Tire exposure:
      • discretionary retail (hardlines, sporting, auto)
    • Macro backdrop:
      • higher rates
      • cautious consumer

    Effect:

    • Multiple compression across retail
    • No bid on dips

    4) No earnings / catalyst support

    • No:
      • earnings release
      • guidance upgrade
      • major news

    → Selling is purely positioning + macro


    5) Technical levels driving flows

    • Support (previous): ~C$185 → broken
    • Current support: ~C$175–178
    • Resistance: ~C$185–188

    Implication:

    • Former support becomes resistance → bearish structure

    Data & Evidence

    DateClose (C$)Change
    Mar 6192.95-1.82%
    Mar 10190.01+0.10%
    Mar 13186.81+0.23%
    Mar 17188.35-0.97%
    Mar 18185.92-1.29%
    Mar 19183.10-1.52%
    Mar 20178.39-2.57%

    Net: ~-7% over 10 days


    Valuation Logic (short-term)

    • Retail names sensitive to:
      • interest rates
      • consumer demand outlook
    • Current adjustment:
      • lower expected discretionary spending → lower multiple

    Risks (driving the move)

    • Consumer slowdown (Canada)
    • Rate sensitivity (big-ticket retail)
    • Margin pressure (promotions, inventory)
    • Lack of near-term catalyst

    Scenarios (next 2–4 weeks)

    Bull

    • Reclaim > C$185
    • Target: C$190

    Base

    • Range: C$175–185

    Bear

    • Break < C$175
    • Target: C$168–170

    Actionable Takeaways

    • This is a clean macro-driven downtrend, not company-specific news
    • Key shift:
      • from range-bound → bearish structure
    • Critical level:
      • C$185 now resistance
    • Stock behavior:
      • tracking consumer discretionary sentiment, not fundamentals (short-term)
  • Mar 20/26: Canadian Stocks Plummet As Gulf War Shows No Sign Of De-escalation

    Extending the nosedive seen over the two previous sessions, Canadian stocks plunged on Friday as inflationary concerns due to the intensifying gulf war pressured investors away from risky assets.

    After opening below yesterday’s close, today the benchmark S&P/TSX Composite Index traded firmly negative before settling at 31,317.23, up by 537.75 points (or 1.69%).

    Of the 11 sectors, only Consumer Staples posted gains today.

    The U.S.-Israel versus Iran war entered day number twenty-one.

    Today, Kuwait’s largest oil refinery, Mina al-Ahmadi, which processes around 730,000 barrels of oil per day, was struck by Iran, leading to the shutdown of several of its units.

    Following Israel’s massive attacks on Iran’s South Pars gas field, Iran conducted strikes on Qatar’s largest LNG plant, Ras Laffan. The facility suffered extensive damage, with the resumption of operations estimated to begin only after a year.

    Iran warned that it will show “zero restraint” if its facilities are attacked again.

    With an end to the conflict, becoming unpredictable, the spike in crude oil prices and the resultant inflation concerns, along with vanishing expectations of any rate cut in the near-term, have forced investors to avoid making “big” investments.

    The Strait of Hormuz, a narrow waterway off Iran’s coastal region remains blocked for vessels carrying oil and energy from Arab nations.

    The U.S. Federal Reserve held interest rates at the current 3.50% to 3.75% range on Wednesday.

    Market participants have canceled their bets on lowering of interest rates by the Fed, with many of them anticipating a rate hike this year.

    The CME Group’s FedWatch Tool was last seen indicating that traders were betting on a 12.40% chance of a “quarter-point rate hike” at the April meeting.

    Other central banks globally have followed suit, expressing concerns about the impact of skyrocketing crude oil prices on national economies and the inflationary effects.

    On Wednesday, the Bank of Canada elected to hold interest rates at the current 2.25% level.

    Data released by Statistics Canada today revealed that Canadian producer prices rose by 0.4% month-over-month in February, below market forecasts of a 1.1% increase. Producer Prices surged 5.4% in January compared to the same month in the previous year.

    A preliminary estimate revealed that retail sales in Canada increased by 0.90% from February.

    With rate-cut expectations receding from the radar, the attention of traders is now focused on any breakthrough in the Canada-United States-Mexico agreement.

    The only sector that gained in today’s trading was Consumer Staples (0.17%).

    Among the individual stocks, Maple Leaf Foods (2.37%), Saputo Inc (1.36%), Metro Inc (0.80%), and Weston George (0.45%) were the prominent gainers.

    Major sectors that lost in today’s trading were Utilities (2.02%), IT (2.62%), Healthcare (2.94%), and Materials (3.13%).

    Among the individual stocks, Lithium Americas Corp (7.59%), Vizsla Silver Corp (6.85%), B2Gold Corp (6.75%), Perpetua Resources Corp (5.77%), and Curaleaf Holdings Inc (4.75%) were the notable losers.

    Orla Mining Ltd (4.50%) and Secure Waste Infrastructure Corp (3.65%) were among the prime market-moving stocks today.

  • Mar 20/26: Major indexes end sharply lower, bond yields surge as traders increase bets for BoC and Fed rate hikes

    Markets update

    • Stocks ended sharply lower, as the U.S.-Israeli war against Iran entered its fourth week, deepening worries about inflation ⁠and the ​potential for higher interest rates. The U.S. military was deploying a large amphibious assault ship with thousands of additional Marines and sailors to the Middle East, while Iran’s new supreme leader hailed ​Iran’s “unity” and “resistance.”
    • The S&P 500 declined 1.51% to end the session at 6,506.48 points, its lowest since September. The Nasdaq slumped ​2.01% to 21,647.61 points, leaving it down almost 10% from its record high close on October 29. The Dow Jones Industrial Average declined 0.96% to 45,577.47 points.
    • The S&P/TSX composite index was down 1.69%, at 31,317.23. All major ​sectors on the TSX were in negative ‌territory, with materials leading losses, down 3.1%. Energy stocks fell 0.6%. The TSX fell 3.8% this week and closed at its lowest level since December, extending its total decline since ​the Iran war began to nearly 9%.
    • Short-term bond yields were sharply higher in both the U.S. and Canada. Money markets are now fully pricing in a quarter-point interest rate hike by the Bank of Canada by this July’s policy meeting. Almost three quarter-point rate hikes are priced in by the end of this year. Canada’s 2-year bond yield, sensitive to central bank policy moves, was up 23 basis points by late afternoon to its highest level in more than a year. For the Fed, interest-rate futures were pricing ⁠around a ​25% chance of a rate hike by December.
    • Oil prices jumped ‌to their highest in nearly four years, as Iraq declared force majeure on all oilfields developed by foreign oil firms. Brent futures for May settled up $3.54, or ⁠3.26%, to $112.19 ​a barrel, the highest since July 2022. U.S. West Texas Intermediate crude futures for April, which expired on Friday, settled up $2.18, or 2.27%, at $98.32. 
    • Gold prices fell nearly 2 per cent as the U.S. dollar strengthened.