Toyota is investing $3.6 billion to expand its San Antonio, Texas, assembly plant, a move expected to create about 2,000 new jobs and bring Toyota Tacoma pickup production from Mexico to the Lone Star State.
The automaker announced Monday that it will build a second vehicle assembly line at its San Antonio campus, allowing the facility to assemble the Tacoma alongside the Tundra and Sequoia.
As part of the expansion, Tacoma production will gradually transition from Toyota’s Baja California plant in Mexico over the next four years, according to the company. Toyota will continue producing Tacoma pickups at its Guanajuato, Mexico, plant.
The project will add about 2.5 million square feet to the manufacturing campus, effectively doubling the site’s size by 2030 and bringing Toyota’s total investment in the San Antonio operation to $8.3 billion since construction began in 2003. Toyota previously moved Tacoma production from San Antonio to its Guanajuato plant in 2020.
Workers stand by the assembly line at the new rear axle plant at Toyota Texas in San Antonio on March 2, 2026. (Katina Zentz/San Antonio Express-News via Getty Images)
Toyota said the investment reflects its confidence in North America’s workforce, innovation and long-term growth potential. The expanded facility will also incorporate advanced manufacturing technologies designed to increase production flexibility.
The announcement is another major manufacturing win for Texas, which has attracted billions of dollars in industrial investment in recent years as companies cite the state’s business-friendly policies, workforce and available land. Gov. Greg Abbott said the expansion, supported by the Texas Enterprise Fund and JETI program, will qualify for a $20 million state grant and other incentives and reinforces Texas’ position as a leading destination for advanced manufacturing.
President Donald Trump said the U.S. ceasefire with Iran was over after a blow-up in hostilities this week, with both sides accusing each other of violating the temporary truce.
Later, Trump said the U.S. will “very probably” attack Iran “hard again tonight.”
Trump also signaled the U.S. would reimpose its naval blockade in the Strait of Hormuz.
He later seemed to downplay the nuclear threat posed by Iran, while ruling out the need for any U.S. troops on the ground in the country. Trump had justified starting the war with Iran by citing concerns about it being poised to develop a nuclear weapon.
The U.S. trade deficit widened sharply in May as an artificial intelligence investment boom helped to drive imports of capital goods to a record high, suggesting that trade remained a drag on gross domestic product in the second quarter.
The trade gap jumped 42.2 per cent to US$77.6-billion, the Commerce Department’s Bureau of Economic Analysis and Census Bureau said on Tuesday. Economists polled by Reuters had forecast the deficit at US$78.5-billion.
Imports increased 3.3 per cent to US$395.3-billion, with imports of capital goods soaring to a record high US$128.0-billion.
Businesses are spending heavily on AI, whose buildup is heavily reliant on imports. Exports dropped 3.2 per cent to US$317.7-billion, though shipments of petroleum were the highest on record amid the Middle East conflict. The U.S. is a net oil exporter.
Trade has subtracted from GDP for two straight quarters. The Atlanta Federal Reserve’s model is currently forecasting GDP increasing at a 1.2-per-cent annualized rate in the second quarter. The economy grew at a 2.1-per-cent pace in the January-March quarter.
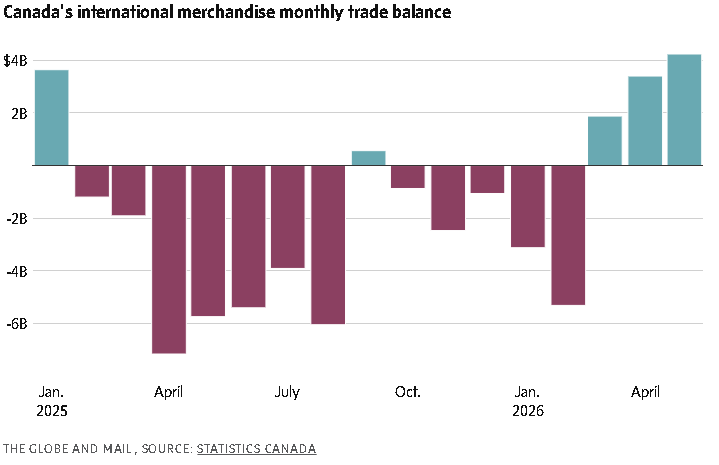
Canada’s trade surplus hit a four-year high in May as the conflict in the Middle East buoyed oil and other global commodity prices and aluminum exporters found new markets.
Merchandise exports rose 0.9 per cent, the fourth consecutive monthly increase, to a record $77.1-billion, Statistics Canada reported Tuesday. Imports declined 0.2 per cent.
That pushed Canada’s trade surplus with the rest of the world to $4.2-billion, from an upwardly revised $3.4-billion in April. That’s the largest trade surplus since May, 2022, and the second largest surplus since the summer of 2008, just before the global financial crisis.
Meanwhile, Canada’s trade surplus with the United States widened to $11.6-billion from $10.3-billion in April, the largest surplus since January, 2025, when Canadian companies tried to front-run President Donald Trump’s incoming tariffs.
The run of strong export data in recent months has been driven by the spike in global oil prices, caused by the U.S.-Iran war and the closing of the Strait of Hormuz to oil tanker traffic. After posting a towering $5.3-billion trade deficit in February, Canadian exports have jumped 22-per-cent over four months, leading to a string of trade surpluses.
Most of the increase has been driven by higher prices, not greater shipment volumes. In real (price-adjusted) terms, exports in May were essentially flat.
“Canadian trade surpluses can come and go quickly with swings in oil prices, and this is probably the high watermark for now,” Bank of Montreal senior economist Robert Kavcic wrote in a note to clients. “Still, net exports look to add firmly to growth in Q2, another data point that suggests the Canadian economy has snapped out of its two-quarter funk.”
Since Washington and Tehran announced a peace agreement in mid-June, the price of a barrel of West Texas Intermediate crude has fallen to around US$70 – well below the US$90 to US$110 range in May.
Canadian energy exports actually declined 2 per cent in May compared to April. However, this was more than offset by a 16-per-cent increase in metal ores and non-metallic mineral exports, led by a jump in sulphur exports.
“This increase occurred in a context of constrained global supply, as sulphur shipments transiting through the Strait of Hormuz have slowed since the conflict in the Middle East began,” Statistics Canada said.
Aluminum exports rose 50.7 per cent to reach $1.2-billion, the highest export value since May, 2022. This increase was led by shipments to the Netherlands, Italy and Greece.
The aluminum market has been upended by U.S. tariffs on the metal as well as the closing of the Strait of Hormuz. Around 10 per cent of global aluminum production comes from countries in the Persian Gulf and aluminum prices rose sharply this spring.
Beyond increased aluminum shipments to Europe, there were few signs of the federal government’s trade diversification agenda in the May numbers. Exports to the U.S. rose 1.5 per cent, the fourth consecutive monthly increase.
Exports to the rest of the world declined 0.3 per cent, after a sharp 4-per-cent drop in April. Most of the trade diversification story over the past year has been about higher gold prices and greater gold shipments to the United Kingdom. This has slowed in recent months.
Overall, exports rose in seven out of 11 categories, including consumer goods, chemical, plastic and rubber products, and food products.
Imports declined 0.2 per cent in May, driven by a large drop in the value of metal imports, including gold, iron and steel and scrap metal. Looking beyond metals, imports actually increased in nine out of 11 sectors.
“Trade flows continue to be shaped by uncertainty surrounding U.S. trade policy, although our broader expectation remains that trade will become less of a drag on Canadian growth than it was in 2025 as the international environment gradually stabilizes,” Royal Bank of Canada economists Abbey Xu and Nathan Janzen wrote in a note to clients.
“The recent CUSMA joint review did little to change our base-case outlook that North American trade rules will remain broadly intact, though negotiations are likely to remain an important source of uncertainty,” they wrote, referring to trade pact between Canada, Mexico and the United States.
Last week, the Trump administration opted not to extend the trade agreement for another 16 years. The deal remains in place but moves into a period of annual reviews until 2036. Trade negotiations among the three countries are expected to continue over the summer.
Main TSX driver for week ending Friday, July 10, 2026: Canada’s June employment report on July 10 at 8:30 ET; a strong print could lift banks/consumer cyclicals but raise rate-risk, while a weak print could support gold/defensives but hurt growth sentiment.
U.S. Fed minutes on July 8 are the key external macro event; markets are looking for confirmation that the weaker U.S. labour data reduced near-term Fed hike risk.
Materials led the TSX last week as gold and copper rallied; if metals hold, miners remain the highest-beta support for the index.
Energy is the main swing risk: WTI was around US$68.78 and Brent US$71.94 on July 3, with prices pressured by easing Hormuz supply concerns and possible OPEC+ supply increases.
TSX setup: near-record levels after closing 35,274.84 on July 3, so upside needs confirmation from metals, Canadian jobs, and Fed-rate expectations; disappointment could trigger profit-taking.
Key Drivers
1. Canada jobs report — July 10
This is the most important domestic event for the TSX this week.
Result
Likely TSX impact
Sector impact
Strong jobs, lower unemployment
Mixed to positive
Banks, insurers, consumer discretionary positive; rate-sensitive REITs/utilities may lag
Weak jobs, higher unemployment
Mixed to negative
Gold miners and defensives may outperform; banks and cyclicals may weaken
In-line jobs
Neutral
TSX likely follows commodities and U.S. Fed signals
May employment was strong: Canada added 87,800 jobs and unemployment fell to 6.6%, beating expectations. That makes the June report important because markets will test whether May was a rebound or a one-off.
2. U.S. Fed minutes — July 8
The Fed minutes matter because TSX valuation is sensitive to U.S. bond yields, the Canadian dollar, gold, and global risk appetite.
Recent U.S. payrolls were weak: June nonfarm payrolls rose only 57,000, below expectations, and the unemployment rate fell to 4.2%. Markets interpreted this as reducing the probability of a near-term Fed hike.
TSX read-through:
Fed tone
TSX effect
Less hawkish
Positive for gold, tech, utilities, REITs; supportive for TSX multiple
Still hawkish
Negative for gold and rate-sensitive stocks; banks may hold up better
Unclear
More volatility; TSX follows commodities
3. Gold and copper momentum
The TSX rally into July 3 was heavily supported by gold and copper. Reuters reported that the TSX closed at a two-week high on July 3, with mining shares leading as gold and copper gained on lower Fed-hike expectations.
Copper strength supports base metals and industrial cyclicals.
A stronger U.S. dollar or hawkish Fed minutes would pressure both.
4. Oil, Hormuz, and OPEC+
Energy is the risk to the upside and downside. Oil has eased as U.S.-Iran peace efforts and partial reopening of Hormuz reduced supply fear. Reuters reported Brent at US$71.94 and WTI at US$68.78 on July 3, with prices nearly unchanged for the week.
OPEC+ is also expected to consider another output-target increase for August, reportedly around 188,000 barrels/day, which could cap crude prices if demand remains soft.
Oil move
TSX impact
WTI rebounds above US$72
Positive for CNQ, SU, IMO, energy weighting
WTI stays US$67–70
Neutral to mild negative for energy
WTI breaks below US$65
Negative for TSX energy; could offset materials strength
5. Early U.S. earnings season
The U.S. Q2 earnings season begins with companies such as Delta Air Lines and PepsiCo. This matters indirectly for the TSX because it affects North American risk appetite and consumer-demand assumptions. Reuters noted investors are watching early earnings for signs of consumer resilience and whether the rally can broaden beyond tech.
Data & Evidence
Date
Event / Data
Why it matters for TSX
Mon, July 6
U.S. final services PMI; ISM services
Affects U.S. growth expectations, yields, CAD/USD, cyclicals
Wed, July 8
U.S. wholesale inventories; FOMC minutes; consumer credit
Fed-rate expectations and credit conditions
Thu, July 9
U.S. existing home sales
Read-through to rates, consumer balance sheet, banks
Fri, July 10
Canada employment report; building permits
Direct impact on BoC expectations, banks, housing-linked equities
All week
Oil, gold, copper
Direct impact on TSX energy/materials weighting
Sources: Scotiabank economic calendar and Reuters market reports.
Valuation Logic
The TSX is close to record territory, so the market needs earnings or rate support to justify further upside. The short-term valuation logic is simple:
(8:30 a.m. ET) Canadian employment for June. The Street is projecting a flat reading (up 10,000 jobs) month-over-month with the unemployment rate remaining 6.6 per cent and average hourly wages growing 3.3 per cent from the same period a year ago.
(8:30 a.m. ET) Canadian building permits for May.
Also: U.S. Fed’s semi-annual Monetary Policy Report is released.
Earnings include: Delta Air Lines Inc.; Hyatt Hotels Corp.
For the past decade or so, Canada’s economy has been flying with one engine down. It sort of worked, but then the second one sputtered out too.
We’re now in that torturous phase while we wait for something to whir back to life. A “transition period,” if we’re trying not to scare people.
There are two ways an economy can grow over the long term – by increasing the country’s labour force or by improving productivity. More workers or more output per worker. Ideally both. Canada is doing neither.
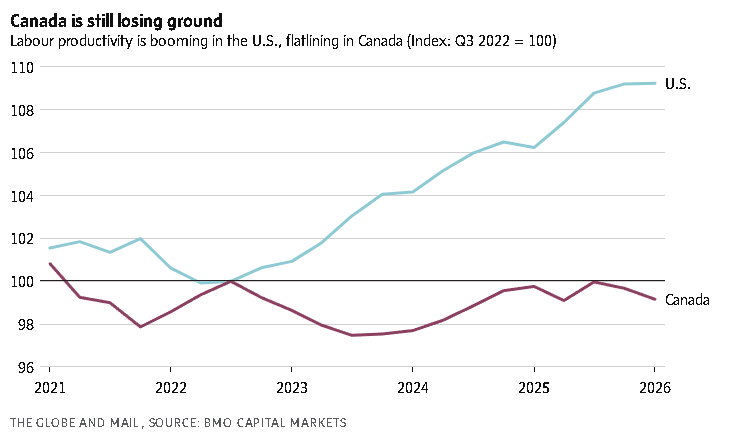
We’ve been famous laggards on the productivity file forever, especially the past decade. Booming population growth helped mask the problem, giving the illusion of good economic health, at the aggregate level at least.
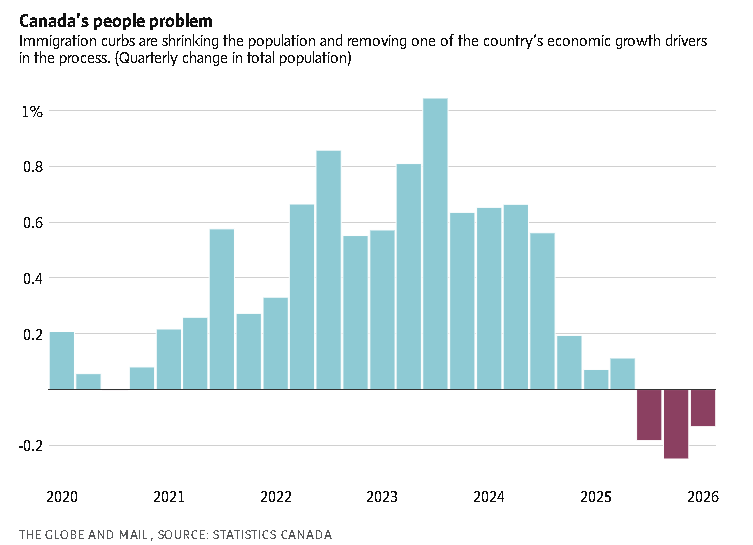
But immigration curbs put an end to that quick fix.
If the country is to expand its economy, it will have to do so the hard way, by finally cracking the productivity problem.
More than a year after the Carney government set out to build a stronger, more self-reliant economy, the numbers are still moving in the wrong direction.
Labour productivity in the business sector declined by 0.5 per cent in the first quarter, Statistics Canada reported a few weeks ago. It was the second straight quarterly decline.
“That number was very disappointing,” said Sal Guatieri, a senior economist at the Bank of Montreal. “If we don’t see some upturn in Canada’s productivity numbers soon, I’ll be pretty worried about our long-term growth prospects.”
The urgency comes from the fact that the country’s population is now shrinking for the first time on record. The next two years will serve as stress test as to whether the Canadian economy can function without the crutch of heavy immigration.
The course correction on immigration, of course, is meant to reverse pandemic-era policies that drew in an influx of temporary foreign workers and international students. At the peak of the surge, Canada’s immigration rate was four times higher than baseline, for reasons that were never entirely clear.
Now, with restrictions in place until at least the end of 2027, population growth is expected to be roughly zero for the next couple of years.
And with that, Canada lost both its drivers of long-term economic growth. So, it’s little surprise that growth has flatlined. Bloomberg’s latest economic survey pegs the consensus GDP growth forecast at just 0.7 per cent for 2026.
Cue the great Canadian economic revival. That’s the idea, anyway. The hostility of the Trump administration toward North American free trade has forced a rethinking of Canada’s economic way of life. Hey, maybe we should finally get around to dealing with that pesky productivity gap.
What is our problem, anyway? We’ve been ruminating on Canadian productivity for years, decades even, and it’s only gotten worse. In 2000, Canada’s output per hour worked was 20 per cent below what the U.S. economy generated. Today, Canada is 30 per cent below the U.S.
There’s the usual list of culprits. Too little competition. Excessive regulation. Maybe not enough fire in our bellies.
It’s really a story of investment. Lack thereof, rather. Canadian companies invest less in their businesses and are less productive as a result. Simple.
Investment in machinery and equipment, for example, is about 20 per cent lower today than it was 10 years ago, on a per-worker basis. Canada also badly trails its peers on research and development spending.
We are currently in the middle of another world-changing wave of innovation with the potential to shape a new age of productivity growth, much like the mass adoption of the internet did in the 1990s.
The early signs already point to Canada falling behind. Artificial intelligence-related spending accounted for around 30 per cent of real GDP growth in the U.S. last year, and just 5 per cent in Canada, according to a recent Desjardins report.
Any way you look at it, the last decade has been a disastrous one for investment in Canada. But we can’t ignore how much a breakdown in the trade relationship with the U.S. is to blame.
Since 2016, employment growth in Canadian industries that cater to U.S. consumers has plateaued at just 2.8 per cent, according to Statistics Canada. All other industries together have had job growth of close to 20 per cent.
Ten years into the protectionist eraU.S. President Donald Trump helped usher in, and Canada is still in the early stages of adapting. The dilemma facing Canada is how to spur investment in a climate designed to stifle it. Mr. Trump is explicit in his desire to lure capital away from Canada.
“The ongoing trade war weighed heavily on today’s productivity numbers, with the largest declines occurring in goods-producing sectors, notably manufacturing, agriculture and construction,” Desjardins economist LJ Valencia said in a note.
There are some indications that corporate Canada is getting on with things. Earnings call transcripts show that tariffs are rarely being discussed any more.
It would be nice to get at least one of the economy’s engines back up and running before gravity does its thing.
When you’re in the middle of a hurricane, the price for umbrellas is going to be expensive, no matter which way the wind is blowing. For stocks, the hurricane is the Nasdaq-100 index, and the direction of winds may be changing.
The spread between Nasdaq 100 1-month implied volatility at 28 and the S&P 500 below 16 is near record highs. It’s been widening all year as the stock market’s returns concentrate around Big Tech winners, but the reason for this latest stretch of the gap is different from a few months ago, when Nasdaq options prices were being skewed by extreme demand for calls.
Today, it’s coming from demand for puts, which have gotten more expensive while premiums for far out-of-the-money calls tapers off. The spread between the implied vol of 25-delta puts in the Nasdaq 100 and S&P 500 – bearish contracts with a one-in-four chance of winning – rose from just 3 points in mid-March to 13.6 today, according to Bloomberg data compiled by Nasdaq. In 2020, the spread reached 13.3. Before that, the only time higher was in September 2008.
“Nobody cared about puts back then, it was all about upside but now that sentiment has shifted,” Kevin Davitt, head of index options content at Nasdaq, said in an interview. “It speaks to potential downside for the high-flying elements of tech.“
The pick-up in demand for puts aligns with slowing momentum in AI stocks that had been consistently rewarding speculators to the upside. The semiconductor ETF (SMH) fell 4.5% Thursday to below $592, a level it first reached in late May.
More than a month of sideways price action in stocks may be piquing interest by bears, but also may not be cause to sound the alarm yet. Call-buying was so intense in the first half of this year that even as the appetite for upside has lessened, it’s still quite high.
Prices for one-standard-deviation out-of-the-money calls on the Nasdaq – contracts with a 16% chance of expiring in-the-money – are currently in the 58th percentile, down from the 99th percentile in May, according to Nations Indexes’ CallDex index.
Another innocuous factor that may be keeping S&P volatility low, adding to the spread: summertime.
“Traders expect the S&P to quiet down, which is normal for the summer,” Scott Nations, president of Nations Indexes, said in a call. “They don’t expect that for the Nasdaq 100, which they think will remain volatile because of the bouncing around in tech.”