Summary
- Gold fell over the past ~10 days: about US$4,338.86/oz on Jun. 16 → US$4,087.01/oz on Jun. 26 = -US$251.85 / -5.8%.
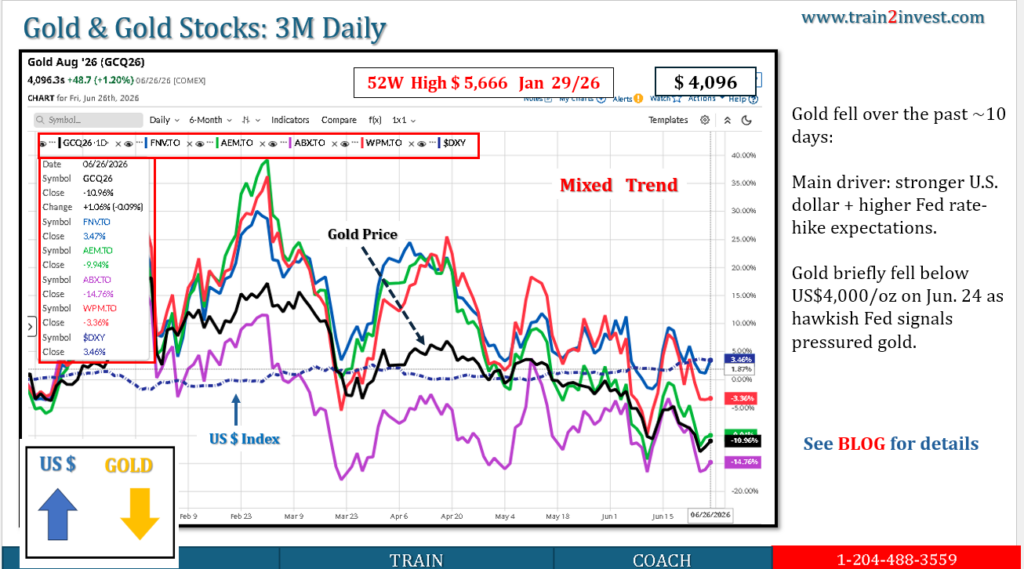
- Main driver: stronger U.S. dollar + higher Fed rate-hike expectations.
- Gold briefly fell below US$4,000/oz on Jun. 24 as hawkish Fed signals pressured non-yielding assets.
- It rebounded on Jun. 25–26 after U.S. inflation data softened the dollar and yields, but still finished the week down about 3% and marked a fourth straight weekly decline.
- Bottom line: short-term gold trend was negative, with a late bounce that has not yet reversed the downtrend.
Price Action
| Date / Point | Gold Price | Move |
|---|---|---|
| Jun. 16 | ~US$4,338.86/oz | Rally on lower rate-hike fears |
| Jun. 23 | ~US$4,131.24/oz | Fell as USD hit one-year high |
| Jun. 24 | Below US$4,000/oz intraday | Hawkish Fed pressure |
| Jun. 26 | US$4,087.01/oz | Rebound, but still weak |
Why Gold Fell
1. U.S. dollar strengthened
Gold is priced in USD. When the dollar rises, gold becomes more expensive for non-U.S. buyers. Reuters said the dollar hit a one-year high on Jun. 23, which pressured gold.
2. Fed rate-hike expectations rose
Gold pays no yield. When markets expect higher rates, bonds and cash become more competitive. Reuters noted that hawkish Fed signals increased rate-hike expectations and hurt gold.
3. Middle East risk premium faded
Earlier, gold was supported by U.S.-Iran uncertainty. But peace-deal optimism lowered oil prices and reduced inflation fears. That reduced gold’s safe-haven bid.
4. Late rebound was dollar/yield driven
Gold rose on Jun. 25–26 because U.S. inflation data pushed the dollar and Treasury yields lower. But the bounce was not enough to erase the weekly loss.
Key Levels
| Level | Meaning |
|---|---|
| US$4,000 | Psychological support |
| US$4,087 | Jun. 26 level |
| US$4,130–4,150 | Near-term resistance |
| US$4,338 | Recent 10-day high area |
Scenarios
| Scenario | Trigger | Gold implication |
|---|---|---|
| Bull | USD weakens, yields fall, Fed hike odds decline | Reclaim US$4,150–4,250 |
| Base | Mixed inflation/rate signals | Range US$4,000–4,150 |
| Bear | Dollar strengthens, Fed stays hawkish | Break below US$4,000 |
Actionable Takeaways
Gold’s 10-day move was mainly a rates-and-dollar selloff, not a collapse in long-term gold demand. The key signal is US$4,000/oz: holding above it keeps gold range-bound; breaking below it confirms more downside pressure.
Leave a Reply
You must be logged in to post a comment.