Summary
- TTTK fell over the past 10 trading sessions: 307.50 on Jun. 15 → 296.55 on Jun. 26 = -10.95 points / -3.6%.
- Weakness was concentrated on Jun. 16–18, especially Jun. 18: -2.51%.
- The index rebounded on Jun. 24: +3.26%, but gave back part of that move on Jun. 25: -1.31%.
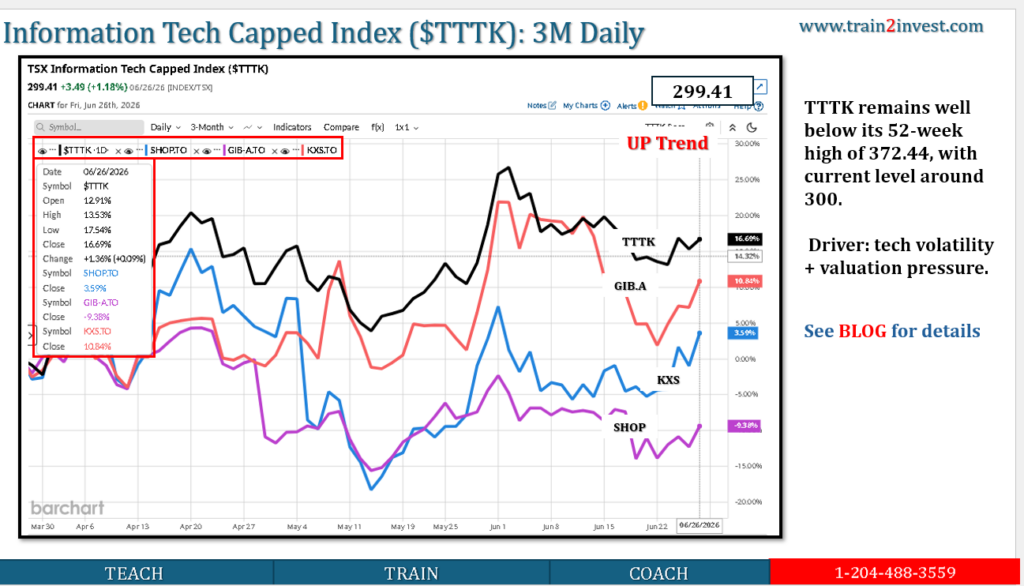
- Driver: tech volatility + valuation pressure, not a broad TSX collapse.
- TTTK remains well below its 52-week high of 372.44, with current level around 296.55.
10-Day Price Action
| Date | Close | Daily Move |
|---|---|---|
| Jun. 15 | 307.50 | +1.21% |
| Jun. 16 | 303.45 | -1.32% |
| Jun. 17 | 299.67 | -1.25% |
| Jun. 18 | 292.16 | -2.51% |
| Jun. 19 | 293.05 | +0.30% |
| Jun. 22 | 291.43 | -0.55% |
| Jun. 23 | 290.38 | -0.36% |
| Jun. 24 | 299.85 | +3.26% |
| Jun. 25 | 295.92 | -1.31% |
| Jun. 26 | 296.55 | +0.21% |
Source: Investing.com historical data.
Why It Moved
1. Tech sold off mid-period
TTTK dropped from 307.50 to 292.16 between Jun. 15 and Jun. 18, a -5.0% move. That was the main damage. The sector was hit by risk-off trading and pressure on growth/tech names.
2. Broader TSX volatility added pressure
Reuters reported TSX weakness around Jun. 23 was driven partly by a technology selloff on Wall Street and lower commodity prices. That hurt sentiment toward Canadian tech as well.
3. Jun. 24 rebound was a technical bounce
TTTK rose +3.26% on Jun. 24, recovering part of the previous decline. But the next day it fell -1.31%, so the bounce was not a clean breakout.
4. Valuation remains a constraint
The iShares XIT ETF, which tracks the same benchmark, showed a P/E ratio of 43.96 and P/B ratio of 6.17 as of Jun. 25. That means the sector is still priced for growth, making it sensitive to earnings expectations, rates, and AI/tech sentiment.
Valuation Logic
| Factor | Impact |
|---|---|
| High P/E | Negative when risk appetite weakens |
| AI/tech sentiment | Supports long-term interest |
| Short-term volatility | Negative |
| Jun. 24 rebound | Supportive, but not confirmed |
| Still below 52-week high | Shows sector has not fully recovered |
Key Levels
| Level | Meaning |
|---|---|
| 290 | Recent support zone |
| 300 | Near-term resistance |
| 307–308 | Previous 10-day high area |
| 372.44 | 52-week high |
Scenarios
| Scenario | Trigger | TTTK implication |
|---|---|---|
| Bull | Breaks back above 300–308 | Momentum improves |
| Base | Holds 290–300 | Range-bound |
| Bear | Breaks below 290 | Further downside risk |
Actionable Takeaways
TTTK’s past 10-day move was a tech-sector pullback, not a collapse. The index fell mainly from Jun. 16–18, bounced on Jun. 24, then stalled below 300. The key signal is whether it can reclaim 300–308; failure keeps it range-bound or vulnerable.
Leave a Reply
You must be logged in to post a comment.