Summary — Gold Price & Gold Stocks: 5D Performance
- Gold futures fell -1.55% over the 5-trading-day window from June 12 to June 19, 2026.
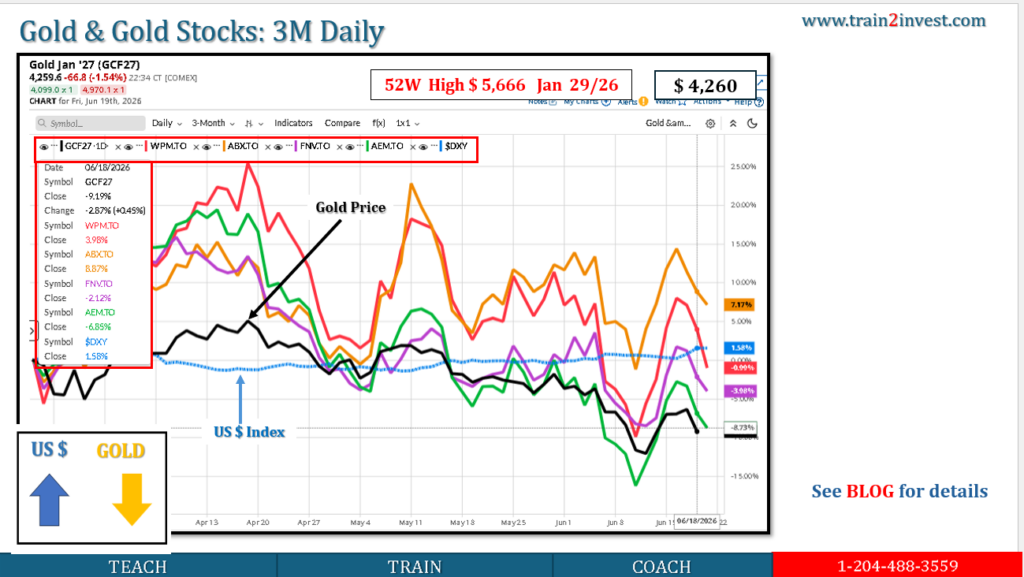
- Gold equities outperformed gold itself over the same period: XGD.TO rose +2.82%.
- Strongest 5D performers among major TSX gold names: WPM.TO +4.73%, K.TO +4.59%, FNV.TO +3.75%, AEM.TO +2.45%.
- Weakest: AGI.TO -5.14%, due to company-specific pressure, and ABX.TO -0.60%.
- Key driver: gold stocks rallied early in the week, but gains faded after gold prices dropped on June 18–19 as hawkish Fed signals and a stronger U.S. dollar pressured bullion. Reuters reported that gold was heading for a third straight weekly loss on June 19.
Data & Evidence — 5D Close-to-Close
Period used: June 12 close to June 19 close, 2026.
| Asset / Stock | Start Close | Latest Close | 5D Change | 5D Return |
|---|---|---|---|---|
| Gold Futures | US$4,238.80 | US$4,172.90 | -US$65.90 | -1.55% |
| XGD.TO — iShares S&P/TSX Global Gold ETF | C$49.99 | C$51.40 | +C$1.41 | +2.82% |
| FNV.TO — Franco-Nevada | C$293.33 | C$304.32 | +C$10.99 | +3.75% |
| AEM.TO — Agnico Eagle | C$227.41 | C$232.99 | +C$5.58 | +2.45% |
| WPM.TO — Wheaton Precious Metals | C$162.32 | C$170.00 | +C$7.68 | +4.73% |
| ABX.TO — Barrick Mining | C$56.25 | C$55.91 | -C$0.34 | -0.60% |
| K.TO — Kinross Gold | C$35.76 | C$37.40 | +C$1.64 | +4.59% |
| AGI.TO — Alamos Gold | C$49.19 | C$46.66 | -C$2.53 | -5.14% |
Gold futures historical data shows June 12 at US$4,238.80 and June 19 at US$4,172.90. XGD.TO historical data shows C$49.99 on June 12 and C$51.40 on June 19. AEM.TO, WPM.TO, ABX.TO, K.TO, AGI.TO and FNV.TO figures are from TSX historical price data.
Key Drivers
1. Gold price was negative over 5 days
Gold started the period with a strong rebound on June 12–16, but the move reversed into June 18–19. Investing.com shows gold futures falling from US$4,381.40 on June 17 to US$4,245.90 on June 18, then to US$4,172.90 on June 19.
2. Fed and U.S. dollar pressure
Reuters reported that gold declined as the U.S. dollar strengthened and the Federal Reserve outlook turned more hawkish. Higher expected rates hurt gold because bullion does not pay interest.
3. Gold stocks outperformed the metal
Despite gold futures falling -1.55%, XGD.TO rose +2.82%. That means gold equities had positive short-term beta from the earlier rally, helped by investor rotation into miners before the late-week gold selloff.
4. Stock-specific divergence mattered
AGI.TO was the clear outlier at -5.14%. Its decline was not simply a gold-price move; StockAnalysis listed fresh news around operational disruption and reduced production outlook for Alamos.
Valuation / Market Logic
| Observation | Interpretation |
|---|---|
| Gold down, miners up | Miners were still benefiting from earlier-week rebound and operating leverage |
| XGD +2.82% vs gold -1.55% | Equity beta was positive, but vulnerable if gold keeps falling |
| FNV/WPM strong | Royalty/streaming names held up better than many producers |
| ABX weak | Large producer underperformed peer group |
| AGI down sharply | Company-specific operational risk overwhelmed gold exposure |
Scenarios — Next 1–3 Weeks
| Scenario | Gold Price Bias | Gold Stock Bias | What Drives It |
|---|---|---|---|
| Bull | Rebound toward US$4,250–4,350 | XGD retests C$53–55 | Softer U.S. dollar, lower rate expectations, safe-haven demand |
| Base | US$4,100–4,250 | XGD range C$50–53 | Gold consolidates after late-week decline |
| Bear | Break below US$4,100 | XGD back toward C$48–50 | Hawkish Fed, stronger USD, weaker commodity sentiment |
Actionable Takeaways
- Gold 5D trend: negative, -1.55%.
- Gold stocks 5D trend: positive overall, with XGD.TO +2.82%.
- Best 5D TSX gold performers: WPM.TO, K.TO, FNV.TO.
- Weakest: AGI.TO and ABX.TO.
- Key support for gold: around US$4,100–4,150.
- Thesis breaker: if gold breaks below US$4,100, recent strength in miners likely weakens quickly.
Educational only. No guarantees.
Leave a Reply
You must be logged in to post a comment.