Author: Consultant

  • Autoliv — Company Overview

    Summary

    • Autoliv Inc. is the world’s largest supplier of automotive safety systems, particularly airbags and seatbelts.
    • Its products are installed by most major global automakers, making Autoliv a useful indicator of worldwide vehicle-production conditions.
    • The company is headquartered in Stockholm, incorporated in Delaware, and trades as ALV on the NYSE and ALIV SDB in Stockholm.
    • Autoliv competes with Magna and Linamar only in limited areas; it is more important as an industry comparable and demand indicator.
    • On July 17, 2026, Autoliv reduced its estimate for global light-vehicle production, contributing to weakness across auto-supplier stocks.

    What Autoliv Does

    Autoliv designs, manufactures and sells passive automotive safety systems—products that protect occupants during a collision.

    Product categoryFunction
    AirbagsProtect drivers and passengers during frontal and side collisions
    SeatbeltsRestrain occupants and manage crash forces
    Steering wheelsIntegrate driver airbags, controls and safety systems
    InflatorsGenerate the gas that deploys airbags
    Pedestrian-protection systemsReduce injury when a vehicle strikes a pedestrian
    Mobility-safety productsSafety equipment for motorcycles, bicycles and other mobility applications

    Autoliv supplies these systems to major vehicle manufacturers worldwide.

    Business Model

    Autoliv is a Tier 1 automotive supplier.

    This means it sells complete systems directly to vehicle manufacturers rather than mainly supplying smaller parts to another supplier.

    Its economic model is approximately:Revenue=vehicles produced×Autoliv content per vehicle\text{Revenue} = \text{vehicles produced} \times \text{Autoliv content per vehicle}Revenue=vehicles produced×Autoliv content per vehicle

    Autoliv can grow faster than total vehicle production when:

    • Automakers install more airbags per vehicle
    • Safety regulations become stricter
    • Autoliv wins contracts from competitors
    • Higher-content vehicles become a larger part of the sales mix
    • Safety adoption increases in developing markets

    In the first quarter of 2026, Autoliv’s organic sales increased 0.8%, despite global light-vehicle production declining 3.4%. This indicated that product launches, market share and regional mix partly offset weaker industry volumes.

    Geographic Exposure

    Autoliv operates globally, with significant exposure to:

    • North America
    • Europe
    • China
    • Japan
    • South Korea
    • India and other Asian markets

    Asia is strategically important because the region produces more than half of the world’s light vehicles. Growing safety regulation and higher safety content per vehicle provide long-term opportunities, particularly in India and other developing markets.

    China also creates risk. Domestic Chinese automakers may use different supplier relationships, lower-cost components or less safety content than premium Western manufacturers. This can reduce Autoliv’s revenue per vehicle even when Chinese vehicle production is growing.

    Customers

    Autoliv supplies most major global automakers. Its customer base includes companies such as:

    • Toyota
    • Volkswagen
    • General Motors
    • Ford
    • Stellantis
    • Mercedes-Benz
    • BMW
    • Hyundai-Kia
    • Honda
    • Chinese electric-vehicle manufacturers

    Customer concentration is material. Autoliv’s five largest customers represented approximately 44% of consolidated 2025 sales.

    This creates two risks:

    1. Losing a major vehicle platform can materially reduce revenue.
    2. Large automakers have considerable negotiating power over pricing.

    Recent Financial Profile

    First quarter of 2026

    MetricQ1 2026
    RevenueUS$2.753 billion
    Reported sales growth6.8%
    Organic sales growth0.8%
    Operating margin8.6%
    Adjusted operating margin8.9%
    Diluted EPSUS$1.88
    EPS change–12% YoY

    Revenue growth was helped by currency and other reported effects, while underlying organic growth remained modest.

    Second quarter of 2026

    Autoliv reported approximately:

    • US$2.8 billion in revenue
    • US$2.43 adjusted EPS
    • Operating profit broadly consistent with market expectations

    The company expected third-quarter margins to remain near first-half levels, followed by a stronger fourth quarter.

    Why Autoliv’s July 17 Report Mattered

    The main concern was not that Autoliv reported a collapse in earnings. The concern was its weaker view of global automobile production.

    Autoliv reduced its 2026 global light-vehicle production assumption from approximately:1.0%to2.5%-1.0\% \quad \text{to} \quad -2.5\%−1.0%to−2.5%

    Its shares fell around 4.8% following the report.

    The message to investors was:

    The global vehicle market remains stable but weaker than previously expected, particularly in Europe and China.

    Because automotive suppliers have high fixed manufacturing costs, a relatively small reduction in vehicle production can have a larger effect on margins and earnings.

    Comparison With Magna and Linamar

    CompanyPrimary businessSensitivity
    AutolivAirbags, seatbelts and safety systemsVehicle production and safety content per vehicle
    MagnaBody structures, seating, powertrain, electronics and complete vehicle assemblyBroad global vehicle production and model mix
    LinamarPrecision components, mobility systems, agricultural and industrial equipmentVehicle production plus agriculture and industrial cycles

    Autoliv is not a perfect comparison for Magna or Linamar because their product portfolios differ.

    However, all three are exposed to:

    • Global vehicle-production volumes
    • Customer pricing pressure
    • Tariffs
    • Foreign exchange
    • Labour and material costs
    • Factory utilization
    • Vehicle-launch timing

    Therefore, Autoliv’s weaker production outlook produced a negative sector read-through for MG.TO and LNR.TO.

    Key Drivers

    Positive long-term drivers

    • Increasing safety regulations
    • More safety equipment per vehicle
    • Growth in Asian vehicle production
    • Increasing penetration of side, curtain, knee and centre airbags
    • Market-share gains and new vehicle-platform awards
    • Pricing recovery for tariffs and input inflation

    Autoliv has previously demonstrated some ability to recover tariff costs from automakers; it recovered approximately 75% of relevant U.S. import-tariff costs during the third quarter of 2025.

    Negative drivers

    • Falling global vehicle production
    • Weak demand in Europe and China
    • Pricing pressure from automakers
    • Dependence on a concentrated customer base
    • Product recalls or safety liabilities
    • Tariffs and supply-chain disruption
    • Foreign-exchange volatility
    • Lower safety content on less expensive vehicles

    Bull, Base and Bear Interpretation

    ScenarioOperating environment
    BullAutoliv gains market share and increases content per vehicle despite flat global production
    BaseVehicle production remains weak, but cost reductions and pricing support margins
    BearProduction declines deepen in China and Europe, lowering plant utilization and margins

    What Would Disprove the Negative Auto-Sector Signal?

    The cautious interpretation of Autoliv’s report would weaken if:

    • Global light-vehicle production forecasts stabilize or improve
    • Magna and Linamar maintain or raise guidance
    • North American vehicle sales remain resilient
    • Autoliv continues materially outperforming global production
    • Supplier margins rise despite weaker production volumes

    Bottom Line

    Autoliv is a global automotive-safety leader, not a vehicle manufacturer. Its financial results provide an important reading on global auto production, vehicle launches and supplier profitability.

    Its July 17 report did not indicate an immediate industry crisis. It indicated that 2026 global vehicle production was weaker than previously expected, which reduced near-term expectations for auto-parts suppliers including Magna and Linamar.

  • Linamar Corp (LNR.TO) 10D 30M

    Summary

    • Linamar (LNR.TO) gained approximately 2.0% over July 13–17, 2026, rising from C$101.62 on July 10 to C$103.66 on July 17.
    • The stock weakened early in the week, closing at C$100.66 on Tuesday, before rebounding strongly Wednesday and Thursday.
    • No major Linamar-specific announcement was identified during the five-day period; the movement was primarily linked to auto-sector sentiment, momentum and positioning.
    • Friday’s 0.95% decline was consistent with profit-taking and weaker auto-supplier sentiment following a cautious global vehicle-production outlook from Autoliv.
    • Linamar’s strong first-quarter results and limited direct tariff exposure continued to provide fundamental support.

    Five-Day Price Pattern

    DateClosing priceDaily interpretation
    July 10C$101.62Starting reference point
    July 13Early-week weaknessAuto-sector caution and profit-taking
    July 14C$100.66Weekly low closing area
    July 15C$103.44+2.76% rebound
    July 16C$104.65+1.17%; third consecutive gain
    July 17C$103.66–0.95% pullback

    Overall five-day change:103.66101.62101.62×1002.0%\frac{103.66-101.62}{101.62}\times100 \approx 2.0\%101.62103.66−101.62​×100≈2.0%

    The stock therefore rose over the week, despite Friday’s decline.

    What Drove the Movement?

    1. Early-week pullback

    LNR.TO entered the week after a strong advance. The shares had already moved from below C$97 in early July to above C$101 by July 10.

    The Monday–Tuesday decline was likely caused by:

    • Profit-taking after the previous rally
    • Concern about global vehicle-production volumes
    • Continued uncertainty surrounding North American tariffs
    • Higher oil prices and bond yields, which can weaken vehicle demand

    There was no significant negative Linamar announcement identified during this period. Therefore, the early decline appears to have been market- and sector-driven rather than a deterioration in Linamar’s reported operations.

    2. Strong Wednesday rebound

    The stock rose from C$100.66 on Tuesday to C$103.44 on Wednesday, a gain of approximately 2.76%.

    This was likely a combination of:

    • Buyers entering after the two-day pullback
    • Continued confidence in Linamar’s earnings outlook
    • Positive momentum in Canadian industrial shares
    • Recognition that Linamar has less tariff exposure than investors initially feared

    Linamar previously stated that more than 90% of its revenue was not affected by the U.S. tariff regime, while maintaining its outlook for sales and earnings growth.

    3. Thursday continuation

    LNR.TO gained another 1.17% on Thursday, closing at C$104.65.

    The three-day advance suggested that investors were repositioning toward Linamar’s company-specific strengths:

    • Diversification beyond automotive manufacturing
    • Exposure to agricultural and access equipment
    • Strong cash flow
    • Share repurchases
    • Relatively modest valuation

    Linamar’s first-quarter sales increased 16.1% to C$2.94 billion, while normalized EPS rose 18.8% to C$3.28. The company also generated C$218.6 million in free cash flow.

    4. Friday pullback

    The shares declined 0.95% Friday, from C$104.65 to C$103.66. The intraday range was relatively narrow at C$102.90–C$103.87.

    The likely explanations were:

    • Profit-taking after a roughly 4% two-day advance
    • Auto-supplier weakness following Autoliv’s cautious global production outlook
    • Investors reducing cyclical exposure before the weekend
    • Technical resistance near the recent C$105–C$107 trading range

    Friday’s decline did not erase the weekly gain.

    Facts Versus Inference

    FindingAssessment
    LNR.TO rose approximately 2.0% over the periodVerified
    The stock rallied strongly Wednesday and ThursdayVerified
    Linamar issued material new company news during the weekNo major announcement identified
    Strong Q1 fundamentals supported the sharesReasonable and evidence-based
    Friday’s decline resulted from Autoliv’s outlookSector read-through; not directly proven
    Tariffs materially damaged Linamar’s current earningsNot supported by the company’s latest disclosure

    Valuation Logic

    Linamar’s recent share-price strength has been supported by earnings growth rather than only multiple expansion.

    Using approximately C$10.50 in trailing EPS and a share price near C$103.66, the stock traded around:103.66÷10.509.9× earnings103.66 \div 10.50 \approx 9.9\times\ earnings103.66÷10.50≈9.9× earnings

    That valuation remains relatively modest for a company reporting double-digit sales and normalized earnings growth. The discount reflects the market’s concerns regarding:

    • Automotive cyclicality
    • Tariffs
    • European and Chinese production weakness
    • Agricultural-equipment demand
    • Capital-intensive manufacturing

    Scenarios

    ScenarioNear-term implication
    BullStrong vehicle production, stable tariffs and continued earnings growth could push LNR back toward its recent C$107 high
    BaseThe shares consolidate between approximately C$100 and C$107 while investors await Q2 results
    BearLower global vehicle production or weaker Industrial-segment demand could push the stock below C$100

    What Would Disprove the Positive Interpretation?

    The thesis that the five-day rise reflected improving confidence would weaken if:

    • LNR.TO falls below C$100 on high volume
    • Linamar reduces its 2026 guidance
    • Tariff costs become materially larger than expected
    • Mobility or Industrial operating margins deteriorate
    • Global vehicle-production forecasts continue to be revised downward

    Actionable Takeaways

    • The five-day pattern was positive overall, not a sustained decline.
    • Wednesday and Thursday’s gains were greater than Friday’s pullback.
    • The movement was driven more by sector sentiment and valuation positioning than by new Linamar-specific information.
    • The next major fundamental test will be Linamar’s August 12, 2026 second-quarter results.
  • Magna International  Inc (MG.TO)

    Summary

    • Magna International (MG.TO) fell about 1.7% on Friday, July 17, 2026, while its U.S.-listed shares declined approximately 1.6%.
    • The principal catalyst was negative read-through from Autoliv’s quarterly results, rather than a new Magna-specific announcement.
    • Autoliv reduced its forecast for 2026 global light-vehicle production from roughly –1% to –2.5%, reinforcing concerns about weaker automobile production, particularly in Europe and China.
    • Magna had risen sharply over the previous year and was trading close to recent highs, making it vulnerable to profit-taking ahead of its July 31 earnings report.

    Why MG.TO Dropped

    1. Weaker global vehicle-production outlook

    Autoliv, another major global auto-parts supplier, reported results on Friday and lowered its global light-vehicle production forecast for 2026 to a decline of approximately 2.5%. Its shares fell about 4.8%.

    The market treated this as an industry signal:

    Lower automobile production means fewer vehicles requiring Magna’s body structures, seating, powertrain, electronics and assembly components.

    This does not mean Magna’s sales will fall by exactly 2.5%. Magna’s customer exposure, vehicle programs and content per vehicle differ from Autoliv’s. However, the weaker production estimate reduced expectations for the entire supplier sector.

    2. Weakness concentrated in Europe and China

    Autoliv indicated that the global auto market remains weak, particularly in China and Europe.

    This matters to Magna because it operates globally and has meaningful exposure to European vehicle manufacturers and production volumes. A weaker production environment can cause:

    • Lower parts volumes
    • Reduced factory utilization
    • Greater pricing pressure from automakers
    • Slower margin expansion
    • Higher restructuring risk

    The concern is therefore not simply vehicle sales; it is Magna’s operating leverage. A modest production decline can have a larger percentage impact on earnings because many manufacturing costs are fixed.

    3. Profit-taking after a strong run

    Before Friday’s decline, MG.TO had gained approximately 64% over the previous 12 months and was trading near its 52-week high.

    When an auto-sector competitor releases cautious production assumptions, investors often reduce exposure first in stocks that have already performed strongly.

    The decline was therefore partly:

    • Fundamental concern about production
    • Valuation normalization
    • Short-term profit-taking

    4. Positioning ahead of Magna’s earnings

    Magna’s next earnings release was expected on July 31, 2026.

    Ahead of earnings, investors may have reduced positions because Autoliv’s report raised questions about whether Magna might:

    • Lower its production assumptions
    • Report weaker European or Chinese volumes
    • Maintain or revise its sales outlook
    • Face additional tariff, foreign-exchange or restructuring costs

    Fact Versus Inference

    FindingAssessment
    MG.TO declined approximately 1.7% FridayVerified
    Magna issued major negative news FridayNo major company-specific announcement identified
    Autoliv lowered its global production forecastVerified
    Autoliv’s report caused Magna’s declineStrong market inference, not mathematically provable
    Profit-taking contributedReasonable inference given Magna’s prior gains
    Magna’s earnings outlook has deterioratedNot yet established; requires Magna’s results or guidance

    Bottom Line

    Friday’s MG.TO decline was mainly an auto-sector read-through. Autoliv’s weaker global vehicle-production forecast increased concerns that Magna could face softer volumes, particularly in Europe and China.

    The approximately 1.7% decline was moderate, not a signal that investors expected an immediate collapse in Magna’s business. The stronger test will be whether Magna maintains its sales, margin and earnings guidance when it reports results.

    What would disprove this explanation: MG.TO continuing to fall despite stable global production estimates, strong Magna results and unchanged guidance would indicate that company-specific valuation or operational concerns are more important than Friday’s sector news.

  • Consumer Discretionary Index ($TTCD)

    Summary

    • TTCD—the S&P/TSX Capped Consumer Discretionary Index—was volatile and generally weakened during July 13–17, 2026, after closing at 406.75 on July 10.
    • The largest identifiable factor was profit-taking after Aritzia’s 7.4% post-earnings jump on July 10.
    • Higher oil prices and bond yields increased inflation and interest-rate concerns, which are usually negative for discretionary spending and sector valuations.
    • Broader risk sentiment improved temporarily midweek but deteriorated again Friday as global equity markets sold off.
    • I could not verify a complete official set of TTCD closing values for all five sessions; therefore, the causal attribution below is based on confirmed market and constituent evidence rather than a precise daily decomposition.

    Five-Day Movement

    PeriodTTCD directionMain explanation
    Monday, July 13Downward pressureProfit-taking after the previous Friday’s strong rally; renewed U.S.–Iran tensions lifted oil prices and bond yields
    Tuesday, July 14Mixed/softInflation uncertainty and a U.S. 10-year Treasury yield around 4.6% pressured rate-sensitive consumer shares
    Wednesday, July 15ReboundImproved global equity sentiment helped TTCD rise 0.64% to 403.01
    Thursday, July 16MixedInvestors balanced strong corporate earnings against persistent oil and interest-rate risks
    Friday, July 17Renewed pressureGlobal technology weakness and broader risk reduction spilled into Canadian equities

    The verified TTCD reading for July 15 was 403.01, up 0.64% for that session, but still below its 406.75 July 10 close.

    Key Drivers

    1. Aritzia’s post-earnings reversal

    Aritzia was the most important company-specific influence.

    On July 10, Aritzia gained 7.4% after reporting:

    • Revenue growth of 43%
    • Comparable-sales growth of 35%
    • Adjusted EPS of C$0.96, above the approximately C$0.88 consensus
    • U.S. revenue growth of 55%
    • Increased full-year revenue guidance

    These results initially lifted both Aritzia and the consumer-discretionary sector.

    However, ATZ subsequently fell from approximately C$158.56 at the July 13 opening to C$143.17 by July 17, a decline of roughly 9.7%. That indicates that much of the initial earnings rally was reversed during the five-day period.

    Economic interpretation: the results were strong, but the stock had already risen substantially. Investors likely shifted from evaluating earnings growth to questioning whether the valuation already reflected that growth.

    2. Higher oil prices hurt consumer expectations

    Renewed U.S.–Iran tensions pushed WTI oil toward or above US$80 per barrel early in the week.

    Higher oil prices can weaken TTCD through:

    1. Higher gasoline and transportation costs
    2. Reduced disposable household income
    3. Higher retailer freight and distribution expenses
    4. Increased inflation expectations
    5. Reduced probability of interest-rate cuts

    This is generally more negative for apparel, automotive, recreational and durable-goods companies than for essential retailers.

    3. Higher bond yields pressured valuations

    The U.S. 10-year Treasury yield traded around 4.58%–4.62% early in the week.

    Higher yields affect consumer-discretionary shares through two channels:

    • Economic channel: mortgages, auto loans and credit-card financing remain expensive.
    • Valuation channel: future corporate earnings are discounted at a higher rate, reducing justified price-to-earnings multiples.

    Higher-valued stocks such as Aritzia and Dollarama can be particularly sensitive to this valuation effect, even when operating results remain strong.

    4. Mixed performance among TTCD constituents

    The sector did not move uniformly.

    Constituent typeLikely effect
    AritziaMajor drag after reversing its post-earnings jump
    Magna and auto-related companiesSensitive to borrowing costs, tariffs, vehicle production and economic growth expectations
    Canadian TireSensitive to discretionary household spending and housing-related purchases
    DollaramaMore defensive; value-oriented demand likely limited the sector’s decline

    Dollarama continued to benefit from strong demand for lower-priced products. Its latest reported quarterly sales rose to C$1.85 billion, while adjusted earnings exceeded expectations.

    Interpretation

    TTCD’s five-day movement was not evidence that the Canadian consumer suddenly deteriorated. It was primarily a combination of:

    • A reversal in Aritzia after a sharp earnings-related gain
    • Higher oil and bond yields
    • Profit-taking in richly valued consumer stocks
    • Broader global risk-off sentiment

    Short term

    The sector remains vulnerable to oil prices, bond yields, inflation data and profit-taking in high-multiple stocks.

    Longer term

    The fundamental picture is mixed:

    • Strong companies continue to report healthy revenue growth.
    • Value retailers remain supported by cost-conscious consumers.
    • Automotive and durable-goods companies remain exposed to financing costs and economic cyclicality.

    Actionable Takeaways

    • TTCD’s weakness was largely constituent- and valuation-driven, not a uniform collapse in consumer spending.
    • Aritzia was likely the most significant marginal driver because its July 10 rally reversed sharply.
    • Falling oil prices and bond yields would support a TTCD recovery.
    • Continued weakness despite lower yields and stable consumer data would disprove the thesis that the decline was mainly macro- and valuation-related.
  • Police say Canadian woman slapped teen over Trump and ICE clothing before ICE detained her

    A Canadian woman living in New Jersey is now facing charges after being accused of attacking a teen wearing pants that displayed “Trump” and “ICE” on the boardwalk.

    According to a report from NJ.com, Kaitlyn E. Tracey, 33, allegedly “slapped the victim across her face and body.”

    It happened after police say she approached the group of teens while recording them on her phone on the Point Pleasant Beach boardwalk.

    Tracey reportedly did not jive with the group’s “patriotic colored sweatpants with political wording,” police said.

    The Point Pleasant Beach Police Department said it happened Friday night, July 3, during the start of the Fourth of July holiday weekend; surveillance video captured her allegedly “striking the juvenile female, once to the body and once to the face, with an open hand.”

    📩 Send me a story idea: kelsie.cairns@fox.com

    📸 Instagram: kelsiecairns_tv

    🎥 Facebook: Kelsie Cairns

    She then ran off from the scene. Days later, Tracey was arrested on charges following an investigation into the case.

    Police confirm Tracey is facing charges of endangering the welfare of a child, simple assault, harassment, and obstruction.

    Tracey, who is a Canadian citizen, came to the U.S. in 2024 with a passport, the report says.

    On Tuesday, a man claiming to be Tracey’s husband posted a tearful plea on social media regarding the incident. In the video he said, “Yesterday July 13, my wife was detained by ICE and brought to Delaney Hall in North New Jersey.”

    A search of the ICE detainee locator confirms Tracey is in ICE custody at the Delaney Hall facility.

  • The Bank of Canada faces a growing credibility challenge

    In a world increasingly characterized by economic shocks and diminishing trust in public institutions, the Bank of Canada faces a growing credibility challenge: Maintain public trust as inflation is increasingly shaped by forces monetary policy cannot control.

    A recent Bank of Canada staff paper finds that supply shocks since 2022 have been larger than those experienced before the pandemic. As a result, a more volatile economy makes inflation exceed the bank’s target more frequently and for longer, while increasing the likelihood that restoring price stability comes at the expense of weaker real economic activity or higher unemployment than Canadians might consider acceptable.

    Still, the central bank needs to convince Canadians these difficult policy decisions are being made in their best interest.

    The bank’s challenge is harder still in an environment where expertise is increasingly contested, AI is facilitating misinformation and polarization is growing worldwide.

    Canada’s inflation rate rises to 3.2% in May, highest in more than two years

    As it prepares to renew its five-year monetary policy framework by the end of 2026, the bank has been consulting a range of stakeholders since November, 2024, including consumers, large banks and pension funds, economists, and representatives of youth and retired Canadians. It shared information from these consultations on its website, noting that “concerns about the politicization of the bank over the past few years” came up repeatedly.

    Back in 2024, the Bank of Canada’s own Public Awareness Survey found that less than half of Canadians (47 per cent) trusted it to act in their best interest. About the same proportion (48 per cent) trusted the central bank to maintain low and stable inflation.

    At the end of 2024, inflation had fallen below 2 per cent, down from a 40-year peak above 8 per cent in June, 2022. It is now at 3.2 per cent, back outside the central bank’s operational range of 1 per cent to 3 per cent, much of it owing to energy prices. Core inflation, excluding food and energy, is half as much at 1.6 per cent in May, below the 2 per cent target.

    Opinion: Bank of Canada has too rosy a view of the world

    Yet such a low core number does not square with what Canadians feel.

    The bank also consults with community members across Canada, recently capturing the results in a May report, which said there was “widespread concern” that the inflation figure “does not align with real-life experiences” and community members questioned whether policymakers understood the pressures ordinary households face. Many objected to excluding food and energy from measures of underlying inflation because those are among the expenses they feel most directly.

    This disconnect between the inflation the bank measures and the affordability pressures Canadians experience, the stakeholder consultation summary warns, “can lead to diminished trust in inflation data and, by extension, in the bank.”

    “Consumer groups noted that the bank’s communications seem tailored to market participants and business leaders as opposed to the public. This created a perception that the bank is not concerned about the impact of its decisions on Canadians’ financial well-being,” the consultation summary said.

    “To foster greater confidence in the bank, many stakeholders advocated for more plain language and accessible explanations of bank decisions that relate more directly to people’s experience with inflation.”

    Opinion: Why the BoC’s next move will be to cut rates, sending the loonie to 65 US cents

    Plain and clear language is only one dimension of transparency, itself a cornerstone of credibility. It also depends on how information is communicated, what information is shared and whether Canadians understand how difficult it is to reach policy decisions.

    The Bank of Canada has come a long way in that respect. For instance, it had resisted publishing the equivalent of the Federal Reserve’s meeting minutes for years, arguing that doing so could inhibit frank discussion within the governing council. It eventually introduced its summary of deliberations in 2023, giving Canadians greater insight into the competing views behind policy decisions. The bank holds press conferences after its policy decisions and has also provided alternative scenarios around its baseline projections when uncertainty has proved too high, as was the case from April, 2025, through January, 2026.

    Should the bank go further by publishing a projected interest-rate path, as once suggested by the International Monetary Fund and similar to the Federal Reserve’s dot plot? Its own research suggests that is unlikely. A staff analytical paper found that policy-rate forecasts are typically not informative beyond one or two quarters and risk creating a false sense of certainty. The point extends beyond Canada: Fed Chair Kevin Warsh declined to submit an interest-rate projection at his first meeting as chair, stressing that such forecasts were “not helpful in the conduct of policy.”

  • July 15: Bank of Canada keeps interest rate unchanged at 2.25% for sixth consecutive time

    The Bank of Canada kept its benchmark interest rate at 2.25 per cent for the sixth consecutive time amid oil price volatility and improving domestic data. The bank said it expects inflation to decline in the coming months, and economic activity to pick up. But it said the path forward will depend to a significant degree on the war in the Middle East and the U.S. trade policy.

    Governor Tiff Macklem and senior deputy governor Carolyn Rogers will hold a press conference at 10:45 a.m. ET. The event is being held virtually, owing to a strike by security personnel at the bank, and will start 15 minutes later than usual.

    Key moments:

  • U.S. consumer inflation slowed in June as gasoline prices retreated

    U.S. inflation cooled last month as the cost of gas, clothes, and used cars fell, providing some relief to consumers, while underlying price pressures also cooled more than expected.

    Prices dropped 0.4 per cent from May to June, the largest monthly drop in four years, the Labor Department said Tuesday. On a yearly basis, inflation declined to 3.5 per cent, down from a year-over-year gain of 4.2 per cent in May and lower than many economists expected.

    Yet oil prices rose for a second day Tuesday as the United States renewed attacks on Iran and President Donald Trump announced a new blockade in the Strait of Hormuz, a key shipping route for about one-fifth of the world’s oil. And many Americans have soured on the economy after five years of elevated inflation, posing a risk to Trump and Republicans in the upcoming midterm elections.

    Still, excluding the food and energy categories, core prices were unchanged in June, a positive sign that underlying inflation is cooling. On a yearly basis, core prices rose just 2.6 per cent, down from 2.9 per cent the previous month. Core inflation remains above the Federal Reserve’s target of 2 per cent.

    The core figures suggest that the gas price spike from the Iran war, while it pushed up airfares and some other costs, hasn’t so far led to broad-based, sustained inflation, economists said.

    “This reading is very much in the camp that the inflation we’ve had this year is transitory,” said Michael Metcalfe, head of macro strategy at State Street Markets. “Yes, gas prices went up, but nothing else did, more or less.”

    Benign report could make Fed rate hike less likely

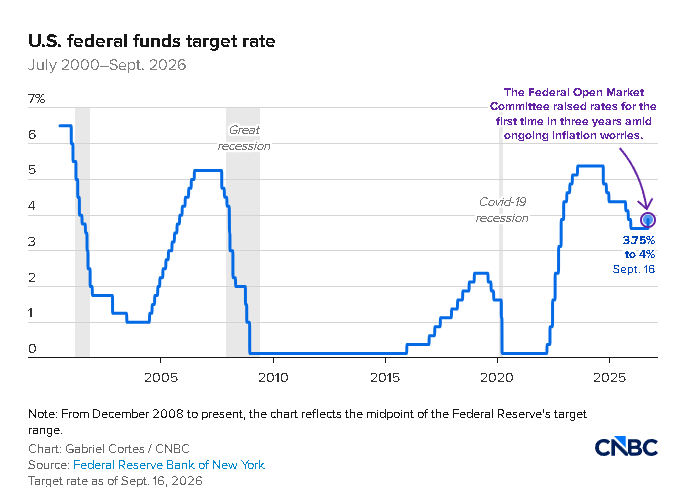
    Tuesday’s report likely reduces pressure on the Fed to boost its short-term interest rate to combat inflation. Last month, Fed officials left their key rate unchanged at about 3.6 per cent.

    “Today’s report gave some breathing room for the Federal Reserve in deciding whether and when to raise interest rates,” Kathy Bostjancic, chief economist at Nationwide Financial, said.

    Fed Chair Kevin Warsh, in written testimony to the House Financial Services Committee, said Tuesday that the Fed has “no tolerance” for high inflation which he pledged would become “a thing of the past.” Yet he provided no hints about what steps the Fed may take in coming months. Warsh will face questions later Tuesday from members of Congress.

    More goods and services saw slower price gains than expected

    A wider range of prices cooled last month than economists had forecast. Electricity prices, which have been elevated by spiking demand from data centres, fell 1 per cent from May to June, though they are still 4-per-cent higher than a year ago. Clothing prices dropped 0.6 per cent from May to June but are 3.9 per cent more expensive than a year earlier.

    Groceries rose 0.2 per cent from May to June and are up 2.7 per cent from last year, while apartment rental costs cooled, rising just 0.1 per cent last month and 2.8 per cent from a year ago.

    The inflation-fighters at the Fed remain sharply divided over next steps, according to minutes of their June 16-17 meeting. About half of policy-makers support raising interest rates by the end of the year to cool borrowing, spending, and price increases, the minutes showed. Another half are willing to wait for signs that inflation may resume falling as gas prices decline, though the minutes predate the recent flare-up of violence in the Middle East.

    And the situation in the Middle East continues to change hour to hour. On Tuesday, the price for a barrel of Brent crude oil, the international standard, climbed 4.6 per cent to US$87.13 after the United States and Iran each said the Strait of Hormuz is under its control. Gas prices have also risen about 6 US cents a gallon in the past week, to a nationwide average of US$3.86 a gallon.

    “Today’s number is a very good reading, but so much is going to depend on what happens in the Middle East,” Bostjancic said.

    Next steps

    Many Fed officials have flagged massive investments in the build out of artificial intelligence infrastructure as a factor that could worsen inflation by pushing up prices for memory chips and other semiconductors, as well as electricity. With chips so much more expensive, companies like Apple AAPL-Q -0.77%decrease, Microsoft MSFT-Q -1.55%decrease, and Dell DELL-N +7.12%increase have announced price increases for laptops, tablets, and video game consoles.

    Other Fed officials have offered conflicting views on what steps the Fed could take next. On Monday, Fed governor Christopher Waller said he was worried about core inflation, which he noted had risen from 3 per cent last December to 3.4 per cent in May, according to the Fed’s preferred measure. He pointed out that the cost of more than two-thirds of services have risen by 3 per cent or more compared with a year ago.

    “If we get another hot reading on core inflation this week, then the (Fed) will need to consider tightening monetary policy in the near term,” Waller said in a speech in New York.

    But last week John Williams, president of the Federal Reserve Bank of New York, said that if core inflation stays at a 0.2-per-cent monthly pace for the rest of this year, the Fed could avoid hiking rates. Tuesday’s data is along the lines of what Williams wants to see.

    Other signs of where prices are headed are mixed. The Federal Reserve Bank of New York said last week that a survey found that nearly half the companies in its region that have paid tariffs still plan to lift their prices further.

    Separately, Walmart last week said it was rolling back prices on thousands of items, including ground beef, potato chips, toys, and clothes. President Donald Trump praised the move on social media and sought to take credit for the reduction, though the company did not mention Trump in its announcement.

  • Jul 13 20262:59 PM EDT

    Stocks drop after Trump reimposes Strait of Hormuz blockade, SK Hynix leads chip stocks lower: Live updates

    Stocks fell on Monday after President Donald Trump announced he was reinstating what he called a blockade on Iranian shipping through the Strait of Hormuz.

    The S&P 500 lost 0.7%, while the Nasdaq Composite was down 1.5%. The Dow Jones Industrial Average traded down 139 points, or 0.3%.

    “We are reinstating the THE IRANIAN BLOCKADE, so named because it is only stopping Iran’s ships or customers from entering or leaving,” Trump said in a post on Truth Social.

    “The U.S.A. will be, from this point forward, known as ‘THE GUARDIAN OF THE HORMUZ STRAIT,’ but as such, and as a matter of FAIRNESS, will be reimbursed, at the rate of 20% on all cargo shipped, for any and all costs necessary to do the job of providing safety and security to this very volatile section of the World,” he continued.

    Oil prices jumped following his announcement, with U.S. West Texas Intermediate futures rising more than 7% to top $76. Brent crude futures, the international benchmark, advanced 7% to above $81 per barrel.

    The latest escalation came after Iran and the U.S. exchanged airstrikes over the weekend. Tehran targeted U.S. facilities in several Gulf countries and declared the Strait of Hormuz closed, though Trump disputed that claim on Sunday, saying the key shipping lane remained open to commercial traffic.

    Trump on Saturday ordered airstrikes on Iran after Tehran attacked a commercial vessel transiting the strait.

    “It’s a range-bound market until you get a true solution in the Middle East,” said Ben Fulton, CEO of WEBs Investments.

    Semiconductor names were under pressure. U.S.-listed shares of SK Hynix lost 6% following the South Korean chipmaker’s Nasdaq debut on Friday, when it soared 13%.

    Shares in Micron Technology were down 5%, while shares of Sandisk shed 12%. Seagate Technology fell 6%. Elsewhere, Advanced Micro Devices was 3% lower, while Intel pulled back 6%.

    “I feel like some of the shift has gotten ahead of itself,” Fulton also said, adding that he still thinks the AI trade is ultimately “alive and well.”

    Additionally, shares of major U.S. banks — namely, JPMorgan ChaseGoldman SachsMorgan StanleyBank of AmericaCitigroup and Wells Fargo — were lower ahead of their earnings results this week. Quarterly results from NetflixJohnson & Johnson and UnitedHealth are also on deck.

    Expectations for the season are high. On average, analysts estimate that second-quarter S&P 500 profits grew by more than 23% year over year, per FactSet.

    On Tuesday, the June CPI report is due out in the morning. Economists polled by Dow Jones are expecting the headline reading to show a 0.2% decline on the month but a year-over-year increase of 3.8%.

    Federal Reserve Chairman Kevin Warsh is also slated to appear before the House Financial Services Committee Tuesday, offering testimony on the central bank’s semi-annual monetary policy report.

    — CNBC’s Yun Li contributed reporting.