Author: Consultant

  • Thomson Reuters Corp (TRI.TO) – Earnings Feb 5, 2026

    Thomson Reuters Corporation provides business information services in the Americas, Europe, the Middle East, Africa, and the Asia Pacific. It operates in five segments: Legal Professionals, Corporates, Tax & Accounting Professionals, Reuters News, and Global Print. The Legal Professionals segment offers research and workflow products focusing on legal research and integrated legal workflow solutions that combine content, tools, and analytics to law firms and governments. The Corporates segment provides a suite of content-enabled technology solutions for legal, tax, regulatory, compliance, and IT professionals. The Tax & Accounting Professionals segment offers research and workflow products focusing on tax offerings and automating tax workflows to tax, accounting, and audit professionals in accounting firms. The Reuters News segment provides business, financial, and international news to media organizations, professional, and news consumers through news agency and industry events. The Global Print segment offers legal and tax information primarily in print format to legal and tax professionals, governments, law schools, and corporations. The company was formerly known as The Thomson Corporation and changed its name to Thomson Reuters Corporation in April 2008. The company was founded in 1851 and is headquartered in Toronto, Canada. Thomson Reuters Corporation is a subsidiary of The Woodbridge Company Limited.

    How the Company Makes Money

    Thomson Reuters generates revenue primarily through subscription-based models and software licensing. Its key revenue streams include:

     1) Legal Professionals: Providing legal research tools, case law databases, and analytics solutions.

    2) Financial Professionals: Offering financial market data, trading platforms, and analytical tools for investment professionals.

    3) Tax and Accounting: Supplying software and services for compliance, tax planning, and accounting professionals.

    4) Media: Licensing news content and providing insights to media organizations. Additionally, strategic partnerships with technology firms enhance its service offerings and expand its market reach, contributing substantially to its revenue growth.

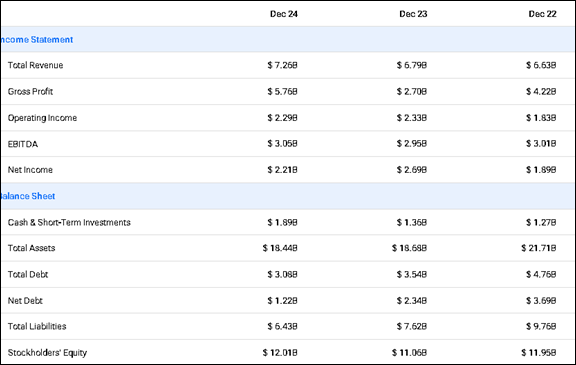
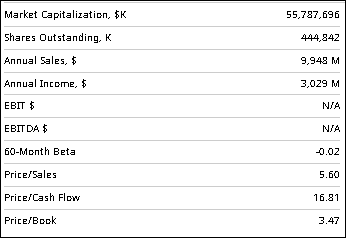
    Thomson Reuters (TRI) Financial Statements

    Thomson Reuters (TRI) Dividend Date & History

    Here’s a data-driven review of Thomson Reuters (trading on the Toronto Stock Exchange as TRI.TO) share price trend over the past 3 months and a forward look at growth expectations over the next 3 months based on the most recent market data and analyst forecasts available.

    1. Recent 3-Month Share Performance (Trend)

    Over the last 3 months, TRI.TO has experienced a significant pullback:

    • The stock has declined sharply, with one snapshot showing a drop of around -27.8% over 1 month and -31.1% YTD as of early February 2026.
    • The decline reflects broad market selling pressure and sector rotation, with TRI underperforming broader indices.
    • Intraday quotes have shown the stock trading near its 52-week low range (~C$118–C$125) versus a cycle high near ~C$299.
    • Technical indicators currently lean bearish, with some systems flagging “sell” momentum.

    Summary: The past 3 months have seen weak performance and volatility, propelled by downgrades, profit taking, and general risk-off sentiment in equities.

    2. Drivers Behind the Recent Trend

    Several factors have influenced this downward trend:

    Earnings & Guidance

    • TRI has delivered sequential revenue growth and reaffirmed its guidance in recent reported quarters, with organic revenue increases driven by AI-enhanced offerings.

    Analyst Revisions

    • Some analysts have cut price targets recently — notably National Bank reducing targets (which triggered a sharp one-day drop).

    Market Position

    • TRI’s business leans on subscription-based and enterprise services (legal, tax, accounting), which historically offers stability, but earnings depend on broader macro spending.

    3. Forward Outlook (Next 3 Months)

    Over the next quarter, near-term stock direction will be influenced by earnings results, broader market performance, and sentiment toward value/tech stocks. Here’s what analysts project:

    Analyst Price Targets & Consensus

    • Most major brokerages maintain a Buy or Hold consensus, even with some downward target revisions.
    • Average 12-month price targets sit well above current levels (often in the ~C$180–C$260+ range), suggesting medium-to-long-term upside from current prices, though this is beyond the next 3 months.

    Short-Term Signals

    Bullish Factors:

    • Strong core revenue and continued investment in AI tools—especially for legal and tax workflows—support longer-term growth.
    • Buybacks and recurring revenue reduce earnings volatility and can underpin near-term support.

    Bearish/Neutral Factors:

    • Technical indicators and recent price declines indicate near-term resistance remains until sentiment stabilizes.
    • Macro headwinds (higher rates, slower corporate IT spend) could delay discretionary growth.

    4. Growth Expectations — Quantitative Summary

    TimeframeExpected Trend / Signal
    Past 3 MonthsWeak / Downtrend; underperformed major indices
    Next 1–3 Months (Technicals)Mixed to cautious; bearish bias unless earnings beat expectations
    3–12 Months (Consensus)Generally moderate Buy with significant potential upside

    Analyst Consensus (12-Month):

    • Price targets generally ~C$180–C$260+ versus current ~C$120s, a substantial implied upside.

    Bottom Line — What Investors Should Know

    Strengths

    • Recurring revenue model, strong brand, and AI-driven product expansion support fundamental growth.
    • Analyst coverage mostly positive long-term.

    ⚠️ Near-Term Headwinds

    • Recent price weakness and technical bearish signals suggest caution for the next few weeks.
    • Market sentiment and macro variables (rates, spending) will strongly influence stock movement.

    Catalysts to Watch

    • Upcoming earnings releases (e.g., next quarterly report).
    • Any new guidance on AI products or subscription growth.
    • Broader market trend shifts (value rotation, rate moves).
  • As software stocks slump, investors debate AI’s existential threat 

    Investors were assessing on Wednesday whether a selloff in global software stocks this ​week had gone too far, as they weighed if businesses ‍could survive an existential threat posed by artificial intelligence.

    The answer: It’s unclear and will lead to volatility.

    After a broad selloff on Tuesday that saw the S&P 500 software and services index fall nearly 4 per cent, the sector slipped another 1 per cent on Wednesday.

    While software stocks have ‍been under ​pressure in recent months as AI has gone from being a tailwind for many of these companies to investors worrying about the disruption it will cause to some sectors, the latest selloff was triggered by a new legal tool from Anthropic’s Claude large language model (LLM).

    The tool – a plug-in for Claude’s agent for tasks across legal, sales, marketing and data analysis – underscored the push by LLMs into the so-called “application layer,” where ⁠these firms are increasingly muscling into lucrative enterprise businesses for revenue they need to fund massive investments. If successful, investors worry, it could wreak havoc across a range of industries, from finance to law and coding.

    The LLMs strategy – and its potential to hurt established businesses – is reminiscent of how Amazon.com disrupted several industries by using its foothold in a niche online book market to build a business that now ‌spans retail, cloud and logistics.

    Some analysts said ‍the success of these AI LLMs was, however, far from guaranteed, given that they lack the specialized data that ‍is crucial to businesses in the industries. The selloff reflected a scramble ‌to shield portfolios as the rapid advances in the technology muddy valuations and business prospects beyond the ⁠standard three-to-five-year forecasts of companies, they said.

    “We are not yet at the point where AI agents will destroy software companies, especially given concerns around ​security, data ownership and use,” said Ben Barringer, head of technology research at Quilter Cheviot.

    Barringer said more volatility is likely to come. “During times of volatility, people often shoot first and ask questions later,” he said.

    That was on full display in recent days. The S&P 500 software and services index has fallen nearly 13 per cent over five straight sessions and is down 26 per cent from its October peak, whereas the S&P ​500 scaled an all-time high just this week.

    The MSCI world software and services index has dropped 13 per cent over five days.

    Taking cues from Wall Street, Asia suffered sharp declines on Wednesday. India’s IT exporters shed nearly 6 per cent and Japanese software and systems developers NEC, Nomura Research and Fujitsu sank between 8 per cent and 11 per cent.

    Selling pressure, however, started to ease in Europe, with the region’s largest software firm SAP down only 0.1 per cent.

    Some analysts and experts said it is too early to call an end to global software and data companies. Nvidia CEO ⁠Jensen Huang said on Tuesday that fears AI would replace software and related tools was “illogical” and “time will prove itself.”

    Mark Murphy, Head ⁠of U.S. Enterprise Software Research at JPMorgan, said it “feels like an illogical leap” to say a new plug-in from an LLM would “replace every layer of mission-critical ‌enterprise software.”

    Software is seen as especially vulnerable to disruption as tools such as Claude increasingly automate the routine tasks that have long underpinned the industry’s pricing power.

    “We are now in an environment where the sector isn’t just guilty until proven innocent but is now being sentenced before trial,” said Toby Ogg, an analyst at JPMorgan.

    “Our sense from investor discussions is that general appetite to step in remains generally low,” he added, citing risks including competition from ‌AI-native firms and clients building their own solutions in-house.

  • Why SHOP.TO & KXS.TO Declined — Simple Explanation

    Even though Shopify is a s

    Both Shopify (SHOP.TO) and Kinaxis (KXS.TO) dropped for very similar reasons: investors became nervous about expensive tech stocks, analysts cut price targets, and the market shifted away from high‑growth names. Neither company is in financial trouble — this is mainly a sentiment and valuation reset.

    🟦 Why Shopify (SHOP.TO) Declined — Simple Explanation

    Even though Shopify is a strong company, its stock fell because:

    1. Tech stocks were hit broadly

    Investors pulled money out of high‑growth tech companies. When this happens, Shopify usually gets hit harder because it’s one of the most expensive tech names.

    2. Slower growth expectations

    E‑commerce is still growing, but not as fast as during COVID. When growth slows, Shopify’s valuation gets questioned.

    3. Analysts lowered price targets

    RBC and others cut targets on several Canadian tech stocks, including Shopify, which pushed the stock down further.

    🟦 Why Kinaxis (KXS.TO) Declined — Simple Explanation

    Kinaxis is a supply‑chain software company with very steady business, but its stock fell because:

    1. It was priced very high

    Kinaxis trades at a very high P/E ratio (around 86–89), so even small concerns cause big drops.

    2. It hit a new 52‑week low

    Once it broke below key price levels, technical traders and algorithms sold more, pushing it down faster. Its 52‑week range recently fell to 139.10, far below its previous high of 212.45.

    3. Analysts cut targets across Canadian tech

    RBC lowered price targets on multiple Canadian tech stocks, including KXS, citing concerns about AI‑related disruption and slower growth.

    🟦 The Simple Bottom Line

    • Nothing is fundamentally broken at Shopify or Kinaxis.
    • No bankruptcy risk.
    • The declines are mostly due to market psychology, valuation resets, and analyst downgrades, not business failure.
    • These companies still have strong revenue, customers, and long‑term prospects.
  • Rare earth miners jump as Trump is eyeing mineral stockpile to reduce China dependence

    Shares of U.S.-listed rare earth miners jumped Monday after news that President Donald Trump is preparing a sweeping plan to build a strategic stockpile of critical minerals.

    The proposal, known as Project Vault, would launch a first-of-its-kind strategic critical minerals stockpile designed for the U.S. private sector, according to a White House official. The plan pairs $1.67 billion in private capital with a $10 billion loan from the U.S. Export-Import Bank, the person said. Trump’s move is aimed at cutting America’s dependence on China for materials essential to electric vehicles, defense systems and advanced technology.

    MP Materials, the operator of the Mountain Pass mine in California, surged 6% in early trading Monday. USA Rare Earth and Critical Metals Corp. rallied 13% and 12%, respectively, as investors bet the initiative could accelerate domestic demand and government-backed financing for the sector.

    Bloomberg News first reported on the proposal earlier Monday.

    USA Rare Earth has already held discussions with Commerce Secretary Howard Lutnick, pitching its domestic mining and magnet assets to the federal government. Those talks would ultimately lead to a proposed deal that could provide the company with about $1.6 billion in funding, subject to certain conditions, and include a U.S. government equity stake.

    The moves build on a more direct role Washington has begun taking in the sector. The Department of Defense struck a landmark agreement with MP Materials last summer that included an equity stake, price floor, and long-term agreement to buy a specific amount of rare earth minerals and magnets.

    — CNBC’s Spencer Kimball contributed to this report.

  • Copper’s slide from record reflects reality of weak demand, rising stocks, analysts say

    A near 9-per-cent drop in copper prices in the last two days reflects a return to reality for a market whose recent surge to record highs had ‍run ahead ​of fundamentals, analysts said – with more losses likely.

    Weak demand, rising stockpiles, and the likelihood of higher supplies all suggested copper’s rally to record highs at US$14,527.50 a metric ton last Thursday was unsustainable, they say.

    Prices had moved way beyond fundamentals, “pushed up by investors crowding into the market,” said Macquarie analyst Alice Fox. “We ⁠think the market was in an around 600,000 ton global surplus last year.”

    Fox said copper prices are still too high, and that to fully reflect fundamentals, they should be below US$11,000 a ton.

    At last week’s record, prices of the metal used to make wiring for conducting electricity ‌were well above the ‍level analysts say is needed to incentivise investment in new production in the coming years.

    On ‍Monday, prices hit a three-week low at US$12,414.50, a ‌drop of 9 per cent in the two most recent trading sessions, with investors ⁠retreating after U.S. President Donald Trump’s appointment of Kevin Warsh as the next chair of the Federal Reserve ​pushed up the dollar higher.

    The macro picture also undermines the case for copper bulls. Trump’s tariffs and trade wars have pressured manufacturing activity around the world over the past year.

    Factory activity in some parts of the world expanded in January, offering policymakers some assurance the hit from higher U.S. tariffs has ​run its course for now, but the growth was from a low base and followed months of shrinking activity.

    China’s Lunar New Year holiday in mid-February will also bring industrial activity to a standstill in the country which consumes more than half of global copper production estimated at around 26 million tons this year.

    Much of the gain in copper prices last year was due to disruptions ⁠to mined supplies, including accidents in Indonesia and Chile. However, production ramp-ups at mines in ⁠Zambia and Mongolia are likely to mean higher supplies this year.

    “While we forecast copper in ‌a deeper deficit market year on year, we still do not see the market as historically out of balance,” said StoneX analyst Natalie Scott-Gray.

    “And although supply risks do outweigh a demand slowdown… fundamentals certainly do not support copper at current levels.”

    Another sign of weak demand are brimming stocks in London Metal Exchange, Shanghai Futures Exchange ‌and Comex registered warehouses, which at more than 930,000 tons combined have more than doubled since August.

  • Gold Tailspins Amid Profit-taking, Fed Chair Announcement, PPI Release

    Gold prices were in freefall on Friday as traders locked in profits from recent gains. In addition, the naming of the next candidate for U.S. Federal Reserve Chair and today’s producer price data pushed the U.S. dollar higher, weighing on the yellow metal.

    Front Month Comex Gold for February delivery nosedived by $604.50 (or 11.37%) to $4,713.90 per troy ounce. However, gold prices skyrocketed by $388.30 per troy ounce (8.98%) for this month and have increased for six consecutive months.

    Front Month Comex Silver for February delivery also were in freefall by $35.747 (or 31.35%) to $78.290 per troy ounce. However, silver prices also skyrocketed by $8.1560 (or 11.63%) per troy ounce for this month, increasing for the ninth consecutive month.

    In January, gold and silver prices soared by around 17% and 39% respectively.

    Yesterday, Front Month Comex Gold for February delivery hit a new record closing high at $5,318.40 per troy ounce after eight consecutive sessions of gains. As a result, investors today opted to book profits.

    The U.S. Fed held interest rates steady at the conclusion of its two-day meeting on January 28. The Fed’s economic outlook has diminished expectations of any near-term rate cuts. The Fed had instituted rate cuts thrice consecutively in late 2025.

    U.S. President Donald Trump has been criticizing current Fed Chair Jerome Powell for keeping rates too high.

    With Powell’s tenure coming to an end by mid-2026, Trump announced his intent to nominate Kevin Warsh, who served as a Fed governor from 2006 until 2011, as Powell’s successor. Warsh’s appointment requires Senate confirmation.

    Economists are a bit “surprised” with Trump’s pick, as Warsh is a “hawkish leaning” banker, supporting higher interest rates in an inflationary environment.

    The U.S. dollar index was last seen trading at 97.00, up by 0.72 (or 0.75%) today.

    The Bureau of Labor Statistics data revealed that month-on-month producer prices rose 0.5% in December 2025, the largest gain in three months, accelerating from a 0.2% increase in November.

    Year-over-year, producer prices rose 3.0% in December, unchanged from the previous month.

    The month-on-month core producer prices (excluding food and energy) jumped by 0.7% from the previous month in December and on an year-over-year basis, core prices rose by 3.3%.

    A funding bill passed by Congress last year to run the U.S. government is lapsing by midnight tonight.

    After hectic parleys between Senate Democrats and Republicans and the White House, a deal has been reportedly struck to pass five bills to finance a large portion of the government spending except the Department of Homeland Security.

    Recently, immigration officials fatally shot two U.S. citizens in Minneapolis, triggering public anger.

    Reflecting on this, a few Democrats threatened to halt any funding that would include bankrolling the DHS, which was a sticking point in the negotiations.

    Though today’s bill strips DHS funding, it has to pass back to the House from the Senate. The House is in recess, with a vote not likely to happen until Monday.

    Hence, the likelihood of a partial shutdown at least for a brief period appears inevitable.

    Despite Trump’s ultimatum to Iran to negotiate on a nuclear deal before time runs out or face severe attacks, Iran has refused to bow to U.S. pressure.

    Yesterday, Iran’s army announced adding 1,000 new “strategic” drones.

    With Iran’s neighbors pushing for diplomacy, tension still persists in the Middle East. Turkey has come forward to mediate a solution.

    In Europe, Russia has consented to pause strikes on Ukraine until February 1 owing to Trump’s appeal.

    Trump made the request to support Ukrainians who are facing a “harsh winter” with heating equipment made inactive after Russian strikes on energy installations.

    Russia is yet to take positive steps on the U.S.-authored peace proposal though Ukraine’s President Volodymyr Zelenskyy is prepared to expedite the deal.

  • Calendar: Feb 1 – Feb 6

    Sunday February 1

    OPEC+ meeting

    Monday February 2

    China, Japan and euro area PMIs

    S&P global manufacturing PMIs

    North American auto sales

    Earnings include: Walt Disney, Tyson Foods


    Tuesday February 3

    10 am ET: U.S. job openings and labor turnover survey

    Earnings include: AMD, Pepsico, Pfizer, Chipotle Mexican Grill, Electronic Arts, PayPal, Clorox, Match Group


    Wednesday February 4

    Euro area consumer price index

    S&P global services PMIs are released across the globe

    815 am ET: U.S. ADP national employment report

    Earnings include: Alphabet, Eli Lilly, UBS, CME Group, McKesson, Suncor Energy, Yum! Brands, Brookfield Asset Management, New York Times, Methanex


    Thursday February 5

    Euro area retail sales and Germany factory orders

    Bank of England monetary policy meeting

    830 am ET: initial jobless claims for previous week

    10 am ET: Global supply chain pressure index

    1225 am ET: Bank of Canada Governor Macklem speaks in Toronto

    Earnings include: Amazon, Shell, ConocoPhillips, ArcelorMittal, Constellation Software, BCE, Telus, News Corp., Open Text, Boyd Gaming, Lightspeed Commerce, Canada Goose, Great West Lifeco, Saputo, Canaccord Genuity, Rogers Sugar, TMX Group


    Friday February 6

    Japan household spending

    Germany industrial production and trade surplus

    830 am ET: Canada employment report for January. Consensus is for 7,000 net new jobs, holding steady from the previous month, with the unemployment rate holding steady at 6.8%

    830 am ET: U.S. nonfarm payrolls. Consensus is 65,000 net new jobs, ahead of December’s 50,000 new jobs, with the unemployment rate steady at 4.4%.

    10 am ET: University of Michigan consumer sentiment

    Earnings include: CAE, Canopy Growth, Philip Morris

    Sunday, February 8

    Japan’s election

  • Canada’s GDP growth unexpectedly stalled in November, seen shrinking in fourth quarter

    Canada’s economic growth stalled in November as an expansion in services was offset by weakness in goods-producing industries, data showed on Friday, as Canada’s economy slows down after almost a year of tariffs and trade uncertainty.

    Gross domestic product was flat month-on-month in November, after a 0.3-per-cent contraction in October, Statistics Canada said.

    Analysts polled by Reuters had forecast marginal growth of 0.1 per cent.

    U.S. President Donald Trump’s tariffs on steel, automotive, lumber, and aluminum have hobbled output in these sectors.

    While the tariff malaise has largely not spread beyond these sectors, a recent Bank of Canada survey showed that business sentiment was subdued, investment was down, and companies expected layoffs.

    On a preliminary basis, Statistics Canada said output was expected to edge 0.1-per-cent higher in December, though the agency cautioned the estimate could be revised.

    November’s figures indicate an annual growth contraction of 0.5 per cent in the fourth quarter, undershooting the Bank of Canada’s most recent forecast of no growth in the final three months of the year, based on monthly GDP by industry data.

    Two consecutive quarters of contraction would constitute a technical recession.

    Canada’s economy is expected to have grown 1.3 per cent in 2025, Statscan said.

    Canada’s economy to end year on weak footing after tariff turmoil

    Final reported quarterly GDP numbers are based on income and expenditure and can differ from the estimate calculated from GDP by industry.

    “The still sluggish momentum towards quarter end may be a concern, as monthly growth rates will need to accelerate for the economy to achieve the (Bank of Canada’s) near 2% MPR forecast for Q1,” Andrew Grantham, senior economist at CIBC Capital Markets, wrote in a note.

    Services-producing industries, which account for roughly three-quarters of economic output, mainly drove growth in November.

    Retail trade, transportation and warehousing and educational services were the top three performing sectors.

    However, wholesale trade declined 2.1 per cent, its largest contraction since April last year, the statistics agency said.

    The strength in services was offset by a 0.3-per-cent contraction in goods-producing industries, the third such contraction in four months.

    Manufacturing output, which contributes over 8 per cent of GDP, contracted 1.3 per cent. The industry remains among the most exposed to trade uncertainty and U.S. tariffs and global trends.

    Output of motor vehicles and parts manufacturing shrank 6.4 per cent owing largely to a global semiconductor shortage, Statscan said.

    The drop in manufacturing was closely followed by the agriculture, forestry, fishing and hunting sub sector, which contracted 1.1 per cent, the agency said.

    The Canadian dollar weakened 0.36 per cent to $1.3537 to the U.S. dollar, or 73.87 U.S. cents. Yields on the two-year government bonds were down 0.5 basis points to 2.407 per cent.

  • How does US tech stocks performance impact share price of SHOP.TO and KXS.TO

    the performance of U.S. tech stocks does influence the share prices of Canadian tech names like Shopify Inc. Class A (SHOP.TO) and Kinaxis Inc. (KXS.TO), but the relationship isn’t mechanical — it’s driven by sentiment, index flows, and growth-tech correlation effects.

    Here’s how U.S. tech performance typically impacts these Canadian tech stocks:


    1. Market Sentiment & Risk Appetite

    • U.S. tech stocks (Nasdaq/S&P 500 Info Tech) often set global growth-tech sentiment: when big U.S. tech names rally (e.g., Apple, Meta, Microsoft, Nvidia), investors become more willing to buy growth-oriented tech stocks globally, including Canadian ones.
    • Conversely, when U.S. tech sells off, risk appetite declines and capital tends to rotate out of growth-y stocks like SHOP.TO and KXS.TO into defensive or value sectors.

    → Impact: SHOP.TO and KXS.TO often move in the same direction as U.S. tech indices, especially during broad tech rallies or drawdowns.


    2. Correlation with U.S. Tech Indexes

    • Shopify’s shares are also listed on the Nasdaq (SHOP), and historically have shown meaningful correlation with U.S. tech benchmarks. When the Nasdaq or S&P 500 Info Tech strongly outperforms, Shopify often participates in that tech rally because it behaves like a global tech growth stock.
    • Kinaxis is a software/AI-related growth name, so it also tends to track broad tech sector moves — albeit usually less closely than Shopify because it’s smaller and more niche.

    3. Leadership Flows & Index Inclusion Effects

    • Shopify was added to the Nasdaq-100 index, meaning index funds and ETFs tied to Nasdaq tech have to hold SHOP, boosting its demand when those funds attract flows.
    • When U.S. tech ETFs outperform and attract capital, some flows spill over into tech ETFs globally, supporting SHOP.TO and often smaller capped tech like KXS.TO too.

    4. Earnings & Macro Sentiment Spillover

    • If big U.S. tech beats expectations — e.g., strong earnings from Apple, Meta, Microsoft — it tends to lift sector sentiment, improving valuations and multiples for tech growth peers globally.
    • That positive mood can spill into SHOP.TO and KXS.TO even if their own fundamentals or earnings are unchanged.

    Example: Canadian tech stocks “zoomed past” tech benchmarks in years when U.S. tech was strong — the rally in U.S. mega-cap tech contributed to stronger performance in Shopify and broader Canadian tech sentiment historically.


    5. Risk-Off Episodes & Valuation Compression

    • During periods where U.S. tech underperforms or growth stocks get repriced lower (e.g., higher interest rate fear, slowing earnings), then growth valuations fall globally.
    • Canadian tech names like SHOP.TO and KXS.TO can get hit harder than broader TSX because they are growth-oriented, higher-multiple stocks — similar to the way U.S. tech is affected in selloffs.

    Example (Historical): When Shopify itself gave a weaker forecast and the TSX tech sector weakened, it dragged Canadian tech down significantly, echoing tech sentiment issues.


    Summary Table: Link Between U.S. Tech ↔ SHOP.TO & KXS.TO

    DriverShopify (SHOP.TO)Kinaxis (KXS.TO)
    U.S. Tech RallyOften benefits as growth sentiment flows inTypically positive, though less correlated than SHOP
    Tech SelloffsCan lead to share price weakness due to risk-offAlso sees pressure, especially on valuation multiples
    Nasdaq Index StrengthDirectly benefits via index inclusion effectsIndirect benefits via broader tech sentiment
    Earnings Beats in U.S. TechBoosts sector sentiment → can lift SHOPProvides positive backdrop but often company-specific
    Macro Shifts / Risk AversionCan amplify volatility in ShopifyOften amplifies KXS volatility too

    In short:

    Canadian tech stocks like SHOP.TO and KXS.TO don’t move solely on U.S. tech performance, but they are strongly influenced by it through sentiment, flows, and risk appetite dynamics. When U.S. tech is outperforming, Canadian tech often follows suit, and when U.S. tech retraces or underperforms, Canadian tech stocks tend to retrace too.
    This linkage is strongest for Shopify due to its Nasdaq status and large market cap, and somewhat less tight for Kinaxis, though still meaningful given its growth tech characteristics.

    High-Level Takeaways

    • Apple and Meta clearly beat street forecasts on both revenue and earnings, driving positive stock reactions (especially for Meta).
    • Microsoft beat estimates too, but market reaction was negative due to concerns about cloud slowdown and higher AI spending.
    • Tesla’s results were weaker relative to expectations, particularly deliveries — a key operational metric — and there’s no clear consensus that it beat on both earnings and revenue.