| Ottawa is naming three projects for potential listing under the new Building Canada Act by the fall, when they would be declared as being in the national interestto accelerate their construction timelines. |
| The projects include two that have previously been referred to the federal Major Projects Office – the Mackenzie Valley Highway Project in the Northwest Territories and the Grays Bay Road and Port Project in Nunavut. |
| Federal ministers announced Wednesday in Yellowknife that a third project – a nuclear waste deep storage project in northwestern Ontario – is also being referred to the Major Projects Office. |
| “The initiation of this process marks a major shift in how we accelerate nation-building infrastructure,” said Energy and Natural Resources Minister Tim Hodgson in a statement. |
| Mr. Hodgson announced the plan alongside Transport Minister Steven MacKinnon and Crown-Indigenous Minister Rebecca Alty. |
| Prime Minister Mark Carney’s government introduced and passed the Building Canada Act, also known as Bill C-5, a year ago. |
Category: Uncategorized
-
Ottawa names first three major projects that could be fast-tracked in national interest
-
June 23/26: S&P 500 falls on global chip rout with Nasdaq off more than 1%, led by Micron: Live updates
The S&P 500 was lower on Tuesday as a tech sell-off that began during the prior session picked up steam overnight, with global markets in Asia routed as memory chip-related shares tumbled.
The broad market index fell 1%, while the Nasdaq Composite slid 1.5%. The Dow Jones Industrial Average traded around the flatline.
The major averages came off their lows as tech stocks outside of chipmakers such as Microsoft and Amazon as well as defensive stocks like Walmart, Procter & Gamble and Johnson & Johnson moved higher. Additionally, International Business Machines shares popped 4% following an upgrade to overweight at JPMorgan, while Sherwin-Williams and Merck saw gains as well.
The tech-heavy Nasdaq shed 1.3% in Monday’s session, dragged down by shares of Alphabet primarily. The selling then picked up globally with South Korea’s Kospi leading the region’s losses. Memory chip leader SK Hynix, which has led a speculative AI frenzy in the country, closed down more than 12%. The South Korea benchmark, which is up 95% this year, was down almost 10%, while Japan’s Nikkei 225 declined 3.55%, breaking eight sessions of gains.
U.S.-traded Micron Technology then followed suit, with the memory chipmaker down 10%. Sandisk fell 12% while components maker Seagate Technology also shed more than 7%. Intel pulled back 3%, while Advanced Micro Devices and Qualcomm lost 5% and 9%, respectively.
The State Street Technology Select Sector SPDR ETF (XLK) dropped 3%. The VanEck Semiconductor ETF (SMH) fell 6%. Meanwhile, SpaceX ticked up more than 1%.
Alphabet continued its losing ways, down marginally after a 5% down day on Monday tied to concerns about high-profile AI talent departures at the company.
“The AI beneficiaries are the sell-off, and I don’t think they’re expensive, but they’re crowded,” said Andrew Slimmon, a senior portfolio manager at Morgan Stanley Investment Management, on CNBC’s “Squawk Box” Monday. “It’s captured kind-of the zeitgeist of the momentum traders and when that happens, you’re going to have sharp sell offs like we’re having. I’d argue it’s healthy.”
European shares also fell sharply on Tuesday, with the pan-European Stoxx 600 down 1%.
The Stoxx 600 Technology index led regional losses, with a decline of 3%. Dutch semiconductor equipment maker ASMI and chipmaker STMicroelectronics, both down more than 6%, were among the biggest downward movers on the Stoxx 600.
Recent IPO Cerebras will report earnings after the bell Tuesday, while Micron will report results on Wednesday after the close
-
Ex-Dem insider reveals she will expose Democrats who covered up Biden’s cognitive decline in new book
Lindy Li says Democrats feared being ostracized if they challenged Biden, calling it pure ‘self-interest’
Lindy Li, a former Democratic fundraiser who switched party affiliation over unheeded warning signs about President Joe Biden’s decline in the 2024 election, is revealing new details about the red flags the party blew by.
“Whatever was out there, it wasn’t the truth. They wanted him to go, and also in my book, I will be telling people exactly who was aware of Biden’s cognitive decline but pretended otherwise,” Li told Fox News Digital during a phone interview.
Li, who is publishing a new book titled “Unburdened” later this year, adds to the picture of the internal discussions, the research, and the panic behind the scenes of the Democratic Party, indicating that Biden enjoyed only shaky support even among his own camp long before he ultimately dropped out of the 2024 election.
Above all, Li said she was shocked by some of the party’s leading figures who expressed reservations behind the scenes about Biden’s decline, but remained staunch defenders of the president in public.

Lindy Li, a former Democratic fundraiser, pictured alongside former President Joe Biden, right. (Lindy Li; Sean Rayford/Getty Images)
“I remember getting a text from Schiff,” Li said, referring to Adam Schiff, D-Calif., then a Democratic candidate for Senate and top Democrat in the House of Representatives.
“I have it in my book. Basically, Adam Schiff was — I can’t remember what he said on TV, but I’m telling you right now that behind the scenes he very much wanted [Biden] to go.”
A spokesperson for Schiff responded to Li’s claims, noting that the Senator had made his doubts about Biden known publicly after a 2024 debate where the president stumbled over his words, lost his train of thought and spoke in a whispery voice that, at times, was difficult to understand. He eventually called for Biden to step aside that July
“The Senator’s concerns and call on President Biden to not run was very public, so none of this is news,” the spokesperson said.
But even beyond Schiff, Li, who ran a formidable fundraising operation for the party and was connected with a wide swath of its figures, said that many figures who were hesitant about Biden’s cognitive abilities were afraid of putting themselves in the path of his political momentum.
“They didn’t want to get ostracized by the party. It’s like the axiom: you come at the king; you better not miss. Everyone would have missed,” Li said.
Li said that fear was bolstered by internal research the party had done, indicating that no one else in the party had the capital to challenge Biden.
“There are many candidates who polled themselves against Biden and then realized that they couldn’t beat him in a primary. It wasn’t a matter so much of anti-Trumpism. It was self-interest,” Li said.
“I’ve seen the polling data, and I also include that in my book — polling no one has seen before.”
Li said that internal discussion had also revealed that Harris wasn’t considered a particularly strong candidate to take on Biden’s mantle.
“She was the weakest candidate in the field,” Li said.
“I also have polling data right before Kamala ascended. We stacked her against Buttigieg, Newsom, Shapiro, Whitmer — all of them,” Li said, referring to a handful of other key figures in the Democratic Party.
Along with fears about going after Biden and coming up short, Li said she believes the Bidens — particularly Joe Biden — inspired a sense of loyalty in the people around him that was hard to shake.
“He had decades of loyalty — his bond with people like James Clyburn,” Li explained, referring to the chief Biden ally who had helped steer the party for decades.
“There’s something about Joe Biden. He was incredibly kind,” Li said.
-
Oil prices fall after Vance says U.S. and Iran made progress in peace talks
- U.S. Vice President JD Vance said “great progress” was made in peace talks with Iran over the weekend.
- Mediators Qatar and Pakistan said U.S. and Iranian officials had agreed on a roadmap aimed at reaching a final deal within 60 days.
-
Treasury Department authorizes Iranian oil sales through August
- The U.S. Treasury Department has authorized the production, delivery and sale of Iranian oil for 60 days.
- Treasury Secretary Scott Bessent said the authorization comes after “productive talks” between Tehran and Washington in Switzerland.
- The U.S. Navy last Thursday lifted its blockade of Iran’s ports and coastal areas.
The U.S. on Monday authorized Iranian oil sales through August after “productive talks” between Tehran and Washington in Switzerland over the weekend, Treasury Secretary Scott Bessent said.
“As part of the framework, Treasury has issued a temporary 60-day general license authorizing the production, delivery, and sale of Iranian oil,” Bessent said in a post on X. The authorization expires August 21, unless its renewed.
Vice President JD Vance said earlier Monday that “great progress” was made during the talks in Switzerland, despite Iran’s declaration over the weekend that it had closed the Strait of Hormuz. U.S. Central Command said Hormuz had not been closed.
Vance said Iran agreed to allow weapons inspectors from the International Atomic Energy Agency back into the Islamic Republic, while Bessent said Tehran had also committed to free and open transit through Hormuz.
The U.S. Navy last Thursday lifted its blockade of Iran’s ports and coastal areas. Iranian supertankers have switched on their transponders, after going dark during the war, as they depart the Persian Gulf loaded with oil.
Iran typically loaded more than 1.5 million barrels per day (bpd) for export before the U.S. imposed its blockade in April, with most of that oil going to China. Loadings declined to just 260,000 bpd in May as the blockade took hold.
Ship traffic through Hormuz plunged during the war as Iran attacked vessels, triggering the largest oil supply disruption in history. About 20% of global crude supplies were exported through the strait before the war.
Traffic has since increased after the U.S. and Iran signed a memorandum of understanding on June 17. Transits rose sharply to 35 on Saturday before declining to 17 crossings on Sunday amid confusion over whether the strait was open or closed due to Iran’s threats, according to data from Kpler.
Traffic remains far below prewar levels, when more than 100 vessels transited Hormuz daily.
Iran must allow ships to transit Hormuz toll free for 60 days under the agreement with the U.S. After that, Tehran is supposed to discuss with Oman and the Gulf states how the strait will be administered, leaving open the possibility that tolls could be imposed later.
-
Canada’s inflation rate rises to 3.2% in May, highest in more than two years
Canada’s annual inflation rate in May accelerated more than expected to 3.2 per cent, a 29-month high, data showed on Monday, as the impact of higher crude oil prices due to the Iran conflict continued to filter through gasoline costs.
Analysts polled by Reuters had estimated the annual inflation rate to touch 3 per cent in May, up from 2.8 per cent in April.
The prices, however, are already showing a major reversal in June after an interim peace deal was signed between the United States and Iran last week, which, analysts have said, could help ease the headline number in June.
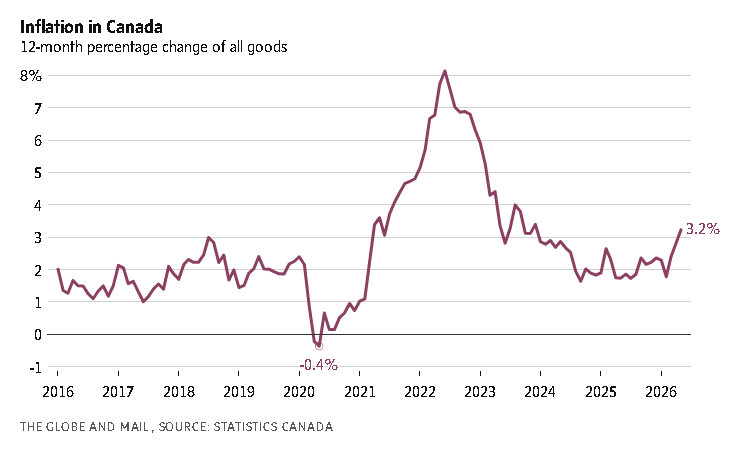
Statistics Canada said excluding the impact of gasoline prices, the consumer price index still posted a higher increase of 2.2 per cent in May from 2 per cent in April led by elevated cost of food, recreation and alcoholic beverages.
The monthly inflation rate rose to 1 per cent in May, exceeding expectations of 0.8-per-cent rise. This is the highest monthly rise in 15 months.
Gasoline prices in May rose by 33.2 per cent on a year-over-year basis. Consumers in May shelled out more for gasoline than from its previous peak four years ago when Russia invaded Ukraine, Statscan said.
This led to an increase in the cost of transportation, which accounts for almost 18.5 per cent of the CPI basket, posting a 9-per-cent annual increase last month.
The inflation number is not likely to alter Bank of Canada’s assessment of underlying inflation as it said earlier this month that it was seeing limited evidence higher energy prices were fuelling broad-based inflation.
Cost of food, which also contributes around 17 per cent of the CPI basket, rose 3.8 per cent in May from 3.5 per cent in April, Statscan said, adding that this was fuelled by an increase in prices of fresh fruits and vegetables which rose by 5.3 per cent and 9 per cent respectively in May.
The impact of higher transportation and food prices were largely offset by shelter costs, the biggest contributor to the CPI basket at close to 30 per cent. Shelter costs rose by 1.7 per cent in May following a 1.8-per-cent increase in April, data showed, especially led by a reduction in mortgage costs which shrunk by 0.2 per cent last month.
The closely tracked measure of core inflation stayed unchanged in May.
CPI-median, the centremost component of the CPI basket, was at 2.1 per cent, while CPI-trim, which excludes the most extreme price changes, was at 2 per cent.
-
AI response to the question: list provinces debt and equalization receipts for 2025
Data gap: the provided search results confirm 2025–26 federal transfer/equalization sources, but do not provide a full province-by-province debt table. The only visible debt-related source is TD’s 2025/26 provincial budget table snippet, but it shows only partial rows. [6]
Province 2025 Equalization receipt 2025/26 debt / budget data visible in provided sources Alberta Not shown in provided results Not shown British Columbia Not shown Not shown Manitoba Receives Equalization, amount not shown in snippets Budget balance: -$1.66B, -1.7% of GDP [6] New Brunswick Receives Equalization, amount not shown Not shown Newfoundland & Labrador Not shown Not shown Nova Scotia Receives Equalization, amount not shown Not shown Ontario Equalization status/amount not shown Budget balance: -$13.5B, -1.1% of GDP [6] Prince Edward Island Receives Equalization, amount not shown Not shown Quebec Receives Equalization, amount not shown Budget balance: -$9.9B; % GDP not visible [6] Saskatchewan Not shown Budget balance: -$427M, -0.4% of GDP [6] Canada’s total Equalization envelope was $25.3B in 2024–25, and major federal transfers to provinces/territories total $108.4B in 2025–26. [4] [1]
🌐 Sources
- canada.ca – Major federal transfers
- canada.ca – Monthly payments made to provinces and territories
- facebook.com – Canadian equalization dollars by province
- lop.parl.ca – Canada’s Equalization Formula
- wikipedia.org – Equalization payments in Canada
- economics.td.com – Canada: Gearing Up for Provincial Budget Season
Equalization receipts (payments) for Canadian provinces in 2025-26 (in $ millions CAD).
These are federal unconditional transfers to “have-not” provinces to enable comparable public services at comparable tax rates. Data is for the 2025-26 fiscal year (from official sources/Wikipedia compilation based on Dept. of Finance Canada). Alberta, British Columbia, and Saskatchewan receive $0.
- Quebec: 13,567
- Manitoba: 4,689
- Nova Scotia: 3,465
- New Brunswick: 3,123
- Prince Edward Island: 666
- Ontario: 546
- Newfoundland and Labrador: 113
- Alberta: 0
- British Columbia: 0
- Saskatchewan: 0
- Total: ~26,170
Notes on equalization: Total program ~$26.2 billion. Quebec receives the largest share due to population size. Payments are calculated based on fiscal capacity (tax bases like income, business, consumption, property, and partial natural resources) relative to a 10-province standard, with adjustments for stability and GDP growth.
Provincial (and combined federal-provincial) net debt for 2025/26:
Exact absolute provincial net debt figures for the end of 2025-26 are projections and vary by source (e.g., provincial budgets, RBC Economics, Fraser Institute). Comprehensive per-province absolute net debt tables are often in detailed fiscal reports or PDFs rather than single web pages, but here is a summary based on available 2025/26 projections and analyses:
- Provincial net debt-to-GDP ratios (approximate, from TD Economics and related analyses for FY 2025/26): Alberta lowest (~8-9%), followed by Saskatchewan (~15%), BC (~26%), etc. Higher in Atlantic provinces and Manitoba/Ontario/Quebec (~35-45%+).
- Combined federal + provincial net debt-to-GDP (Fraser Institute 2026 Edition projections for 2025/26): Manitoba highest (~91%), Alberta lowest (~43%). Combined per-person debt ranges from ~$42k in Alberta to ~$72k in Newfoundland & Labrador.
- Overall trend: Combined federal-provincial net debt projected around $2.44 trillion in 2025/26 (inflation-adjusted nearly doubled since 2007/08). Provincial debt has grown but varies significantly; “have” provinces like Alberta generally have lower debt burdens relative to GDP.
For the most precise/current absolute provincial net debt numbers, check individual provincial budgets/public accounts or consolidated sources like RBC Fiscal Tables or Statistics Canada. Debt figures are often reported as of fiscal year-end (March 31) and include projections.
Equalization data is firm for 2025-26; debt data is more variable as it depends on final audited figures and projections. Let me know if you need per-capita breakdowns, historical comparisons, or details for a specific province!
-
CRA records show temporary residents received $1.35 billion in child benefits over four years

Canada Revenue Agency records reveal that temporary residents received $1.35 billion in child benefit payments over a four-year period. The 2023 data indicates these payments exceeded the $3…
-
U.S.-Iran nuclear talks begin in Switzerland
U.S. Vice President JD Vance said Sunday there was an opportunity to “turn over a new leaf” with Iran as the sides launched talks aimed at building out the interim deal to end the war in Iran reached by the two sides last week.
Vance is holding talks with Iran’s parliamentary speaker, Mohammad Bagher Qalibaf, and Foreign Minister Abbas Araghchi, at a Swiss mountainside resort near Lake Lucerne. Mediators from Pakistan and Qatar were also in the room for the direct engagement.
The U.S. is looking to get Iran locked into negotiations over its nuclear program amid concerns it may be used for military purposes, which Iran denies. Vance also wants to push Tehran to commit to keeping open the Strait of Hormuz, the critical waterway through which about a fifth of world traded oil passes.
But the on-again, off-again conflict in Lebanon, between Israel and Iranian-backed Hezbollah militants, continues to threaten to derail the effort for the U.S. to win concessions from Tehran on its nuclear program and keep the Strait of Hormuz open.
“The question before us now is how much more can we accomplish together? Can we turn over a new leaf?” Vance said in brief comments as the talks, dubbed the “Lake Lucerne Summit,” got under way.
“Can we change relations in the Middle East permanently, or do we go back to doing things the old way, which is not our preference, but is certainly very much something that can happen.”

Iran’s Foreign Minister Abbas Araqchi shakes hands with Pakistan’s Prime Minister Shehbaz Sharif.Fabrice Coffrini/Reuters Iran’s main focus during negotiations on Sunday would be the ongoing war between Israel and Hezbollah in Lebanon, Iranian Foreign Ministry spokesman Esmail Baghaei told Iran’s state news agency ahead of the meeting with Vance.
The interim agreement was signed last week, and now top American and Iranian negotiators are in a 60-day sprint to reach an agreement on the technical details that hold massive implications for the world economy and global security.
Yet only days after signing the agreement, it is being stress-tested after fighting escalated in Lebanon between Israel and the Iranian-backed militant group Hezbollah – and by the subsequent announcement by Iran’s military that it had again closed the vital waterway that transits one-fifth of the world’s traded oil and natural gas. A renewed ceasefire in Lebanon, brokered on Saturday, appeared to be holding.

The convoy carrying U.S. officials, including Vice-President JD Vance, arrives at the Buergenstock resort in Switzerland on Sunday.URS FLUEELER/Reuters Vance stressed that “great progress” had been made on Lebanon. But minutes after he was finished speaking, President Donald Trump took to social media to threaten Iran if it didn’t rein in Hezbollah.
“If they don’t, we’ll hit Iran very hard again, just like we did last week, only harder!!!” Trump wrote.
Iran is cautiously approaching the talks given its previous experience with the U.S. negotiations on the nuclear issue, which twice in the past year have been interrupted by massive military strikes against the country. “The implementation of any document is more important than its signing,” Baghaei said Sunday.
Iran’s president added that Iran will maintain its right to a nuclear program.
“What is certain is that we will never back down from the right to enrich uranium, and the other side is also forced to accept it,” Iranian President Masoud Pezeshkian said Sunday, according to Iran’s state media.

Mr. Vance is joined by Special Envoy Steve Witkoff and U.S. President Donald Trump’s son-in-law Jared Kushner.Pool/Getty Images Vance had originally been slated to be on the ground at the Bürgenstock resort near Lucerne on Friday, but his departure from the United States was delayed after fighting escalated in Lebanon and Iranian officials cancelled plans to attend the talks.
U.S. Central Command disputed Iran’s claim that it had once again shuttered the strait and said U.S. forces continued to monitor the situation to ensure traffic continues to flow through the waterway. Vance has said that millions of barrels of oil have moved through the strait in recent days.
Vance departed the U.S. just after Iranian state TV said Iran’s negotiators had arrived in Switzerland.
The vice president was joined by special envoy Steve Witkoff and Jared Kushner, Trump’s son-in-law, for Sunday’s talks. Witkoff and Kushner were on the ground in Switzerland ahead of Vance to begin sifting through the technical details of the nuclear talks.
Vance and his wife, second lady Usha Vance, arrived at Emmen Air Base outside Lucerne just before 6 a.m. local time, according to his office.
While Vance said he planned to be in Switzerland for just “a day or two,” leaving much of the detailed negotiations to be spearheaded by Witkoff and Kushner, his role in the talks has heightened scrutiny of the vice president at a time when he’s actively considering a 2028 presidential campaign.

Cargo vessels remain anchored off the coast of Oman near the Strait of Hormuz on Saturday. Mr. Trump threatened levy U.S. tolls on vessels passing through the strait if there is no deal with Iran in 60 days.Getty Images/Getty Images Trump and Vance have come under searing criticism from parts of their own party for the deal, with Republican hard-liners unfavourably likening it to a nuclear agreement signed by the Obama administration that Trump and the GOP have insisted did nothing to actually terminate Iran’s nuclear program.
The agreement signed by Trump and Iranian President Pezeshkian immediately allows Tehran to sell its oil freely and paves the way for Iran to tap into billions of dollars in assets that are currently frozen. It also calls for Iran to dilute its stockpile of highly enriched uranium, believed to be buried under nuclear sites that were targeted in U.S. strikes last summer.
The agreement says commercial vessels can pass through the Strait of Hormuz for 60 days without a charge, but does not preclude future fees imposed by Iran. Trump made his own threat on Saturday to levy U.S. tolls on the strait if there is no deal with Iran in 60 days, insisting in a social media post that the money would be for “services rendered as the Guardian Angel to the countries of the Middle East.”
The Trump administration has been working to reassure global markets that the Iran war has been merely a blip on oil prices, as Americans complain the conflict resulted in hiking gasoline prices ahead of peak summer travel months. After the White House announced the deal a week ago, oil futures dropped almost 8 per cent – and markets are expected to closely track the progress of talks when they open for trading on Sunday evening.
Further complicating matters, neither Israel nor Hezbollah is a signatory to the deal between the U.S. and Iran, and Israeli Prime Minister Benjamin Netanyahu has vowed to keep his forces in southern Lebanon until any threat to Israel is eliminated. Hezbollah has refused to halt its attacks unless Israel commits to withdrawing from Lebanon.


