U.S. economic growth slowed more than expected in the fourth quarter amid disruptions from last year’s government shutdown and a moderation in consumer spending, but tax cuts and investment in artificial intelligence were expected to support activity this year.
Gross domestic product increased at a 1.4 per cent annualized rate last quarter, the Commerce Department’s Bureau of Economic Analysis said in its advance estimate of fourth-quarter GDP on Friday. Economists polled by Reuters had forecast GDP rising at a 3.0 per cent pace. The survey was, however, completed before data on Thursday showing the trade deficit widening to a five-month high in December.
The economy grew at a 4.4 per cent pace in the third quarter. The nonpartisan Congressional Budget Office estimated the government shutdown would subtract 1.5 percentage points from fourth-quarter GDP through fewer services provided by federal workers, lower federal spending on goods and services and a temporary reduction in Supplemental Nutrition Assistance Program benefits.
The CBO forecast most of the lost output would eventually be recovered, though between US$7-billion and US$14-billion would not.
Ahead of the release of the report, President Donald Trump posted on social media that the “Shutdown cost the U.S.A. at least two points in GDP. That’s why they are doing it, in mini form, again. No Shutdowns! Also, LOWER INTEREST RATES.”
The report, which was delayed by the record 43-day government shutdown, highlighted a jobless economic expansion as well as a “K-shaped” economy, in which upper-income households are doing well while lower-income consumers are struggling amid high inflation from import tariffs and stalling wage growth.
Those conditions have created what economists and Trump’s opponents call an affordability crisis. Only 181,000 jobs were added last year, the fewest outside the pandemic since the 2009 Great Recession, and down from 1.459 million in 2024.
Growth in consumer spending slowed from the third quarter’s brisk 3.5 per cent pace. Economists say spending has largely been driven by higher-income households and has been at the expense of saving as inflation eroded buying power.
Consumer spending could get a tailwind from what economists anticipate will be larger tax refunds this year because of tax cuts. Economists estimated AI, including data centers, semiconductors, software and research and development, accounted for a third of GDP growth in the first three quarters of 2025, blunting the hit from tariffs and reduced immigration. The stale report will probably have no impact on monetary policy.
Separately, Personal Consumption Expenditure index, the Federal Reserve’s preferred inflation gauge, rose 0.4 per cent in December, on a month-over-month basis, compared to economists’ estimate of a 0.3-per-cent rise. Core PCE, which excludes the volatile food and energy components, rose 0.4 per cent on a month-over-month basis, versus economists’ forecast for a 0.3-per-cent rise.
In December, Tommy Battle’s dream came true. The five-term Mayor of Huntsville is Alabama to the bone, born in Birmingham and a graduate of the state university in Tuscaloosa, but for the past 18 years he’s tried to distance his city from the state’s unsavoury stereotypes.
Huntsville, in the north, is the home of the Saturn rocket program that took on the Soviet Union’s Sputnik. It houses the second-largest biotech research hub in the United States. And it has attracted high-end manufacturing investments such as Blue Origin’s rocket engine plant.
But Alabama tropes are hard to shake: The state is backward and full of bible thumpers and bigots – allegedly. When local companies try to hire from afar, Mayor Battle says recruits often hear the same responses when telling their spouses: “‘Huntsville?’ With one question mark. Then they say, ‘Alabama???’ With three question marks.”
Translation: You’ve got to be kidding me.
But in December, Huntsville had the last laugh. Eli Lilly and Co. was looking to build a US$6-billion manufacturing plant that would create 3,000 construction jobs and employ 450 engineers, scientists, lab technicians and operations staff. After narrowing down the field of 300 bidders, the pharmaceutical giant named Huntsville a winner, one of four new facilities in the U.S. It’s the state’s largest-ever private industrial investment, and it personifies the tagline the Mayor has preached: “Huntsville: a smart place.”
For eons, Canadians have viewed Alabama as a small state that, save for a few pockets, is dirt poor. All anybody seems to know about Alabama is that Montgomery and Birmingham were the centre of the civil rights movement. In 1963, when Martin Luther King Jr. wrote his “Letter from a Birmingham Jail,” he called Birmingham “probably the most thoroughly segregated city in the United States.”
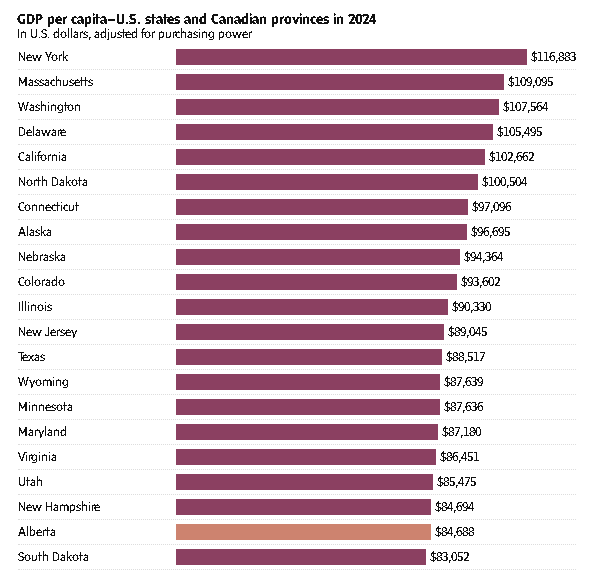
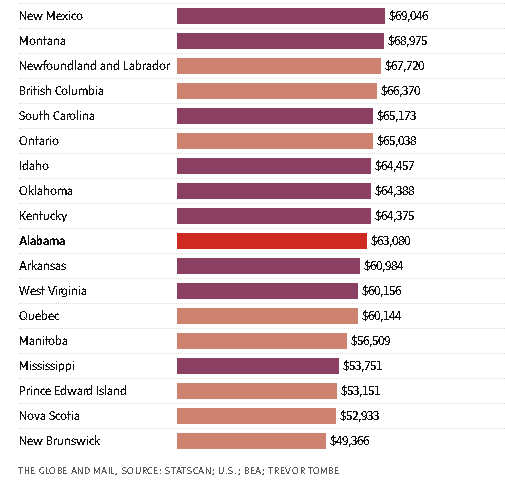
So, it was a shock when Canadian economist Trevor Tombe and the International Monetary Fund ran the numbers in 2023 and 2024 and concluded that Canada had, in fact, become poorer than Alabama.
To measure this, they calculated gross domestic product (GDP) per capita. In simple terms, it’s the size of the Canadian economy in a given year divided by the population. The same was done for Alabama. After adjusting for foreign exchange and some cost differences in both countries, the average for Canada’s 10 provinces was estimated at at US$55,000 in 2022, the same as Alabama. Shortly after, the IMF found Canada had actually fallen behind the southern state. (Canada has since edged ever-so-slightly higher than Alabama; the numbers are volatile from year to year.)
The timing was terrible for the Canadian psyche. Home prices were on an astronomical trajectory, inflation made everyday items such asgroceries far more expensive and there was deep resentment toward Ottawa. Canadians could probably stomach having their living standards slip relative to the broader U.S., the epicentre of the world’s tech revolution. But Alabama?
For an ego check, The Globe and Mail travelled to the Deep South to understand how this happened. Immediately, it was obvious Alabama is misunderstood. In Huntsville, there are as many Subaru Outbacks as there are pickup trucks, and the geography in Alabama’s two largest metropolitan areas – Birmingham and Huntsville – looks nothing like the historical imagery.
“Most people think of Alabama as flat pasture land with cotton fields,” says Daniel Hughes, a real estate executive who took his Montgomery-based company, BSR Real Estate Investment Trust, public on the Toronto Stock Exchange. Huntsville and Birmingham, though, are nestled in the foothills of the Appalachian Mountains. Looking out from Mayor Battle’s seventh-floor office in city hall, the landscape could easily be Vermont.
Alabama is also home to five million people – the same population as Alberta – and its economy is booming. The state’s unemployment rate is now just 2.7 per cent, versus 6.5 per cent in Canada, and its major employers include Airbus SE and giant defence contractor Northrop Grumman Corp. The state has also morphed into an auto manufacturing powerhouse with plants from Mercedes-Benz AG, Toyota Motor Corp., Hyundai Motor Co. and more. In 2024, Alabama made nearly as many vehicles as Ontario.
Of course, there is much more to an economy – and to quality of life – than industrial prowess. Alabama still has some serious flaws. For people living in poverty, there is almost no floor, and access to quality education remains a pipe dream for many.
There are also limits to how much can actually be gleaned from per capita GDP. It is not the Holy Grail. To start, one key variable is population, and Canada’s has exploded over the past four years. That alone skews the numbers.
But being on the ground in Alabama, it was obvious that Canadians need a wake-up call. They tend to view the economy through a historical lens – this is a G7 country that has long punched above its weight. Yet capital is global now and competition for it is fierce. If Canada isn’t careful, places such as the Deep South will continue to steal jobs. The Eli Lilly plant awarded in December could have just as easily gone to Montreal, a pharmaceutical hub.
In other words, it might be time to eat some humble pie. “People have a lot to learn from Alabama,” Mr. Hughes says.
Alabama’s sea change started in 1993. Historically, the state had an agricultural economy fuelled by slavery in the Black Belt, a stretch of rich, dark soil that was ideal for growing cotton. Over time, Alabamadiversified with forestry products, textile and apparel manufacturing, and steel – Birmingham had iron ore, coal and limestone, which are perfect ingredients. But eventually the mechanization of farming, foreign competition for steelmakers and a rising U.S. dollar became troublesome.
By the early 1980s, Alabamahad the second-highest unemployment rate in the country. At a 1985 seminar in Birmingham, Sheila Tschinkel, the director of research at the Federal Reserve Bank of Atlanta, a central bankregional office, laid it all out. Companies, she said, were scared away by “the relatively low educational level of Alabama’s work force and its lack of flexibility, the state’s remoteness from national markets and deficiencies in infrastructure that make outsiders reluctant to move to many sections of the state.” It was a trifecta of doom.
Mercedes-Benz was the saviour. In the early 1990s, the automaker was struggling with high costs at its German plants and competition from Japanese luxury brands such as Lexus, so it decided to launch a luxury SUV plant in the U.S. The automaker made states bid against each other, and Alabama, North Carolina and South Carolina all ponied up big tax incentives. The cherry on top: All three are right-to-work states, which means unions can’t charge individuals mandatory dues.
Workers install a sign near near Tuscaloosa, Ala., announcing a future North American Mercedes-Benz plant, in September, 1993. The German auto maker’s investment in the state kickstarted a wave of companies looking to build their production facilities in Alabama.John C. Hillery/REUTERS
In the end, Vance, a city just outside Birmingham, won the beauty contest. Sometimes it’s the little things that matter. Reports at the time said Alabama simply showed more zeal – plus the Germans liked the woods and rolling hills around Birmingham, which reminded them of the countryside around Stuttgart.
That single investment turned into the tip of a very long spear. A few years later, Honda Motor Co. Ltd. opened a plant in Lincoln, then Hyundai built its own near Montgomery. Mazda Motor Corp. and Toyota are now also in Huntsville, where they share a manufacturing facility. Auto suppliers have piled in, too. Michigan remains the top auto producer in Canada and the U.S., with two million vehiclesmanufactured in 2024, but Alabama is now in the top five, producing 1.2 million vehicles annually, close to the 1.3 million that Ontario churns out.
The irony of all this is that Alabama’s success was almost too good. The incentives started to strain the state’s finances.
Whenever a new opportunity emerged, Alabama would layer discounts on property and sales taxes as well as large capital investment tax credits on top of a competitive corporate tax rate. The state also wasn’t shy to layer on some cash grants. In other words, Alabama would throw the kitchen sink at new investments, and companies could use the benefits up front, before any revenue was generated.
ecause of this structure, Alabama often had to borrow money to fund the program. “We weren’t being great stewards to the taxpayers,” says Greg Canfield, the state’s former commerce secretary, who was tasked with fixing the problem. He has since developed something of a cult following in the state for revamping it while also keeping the investment dollars coming.
To fix the program, Mr. Canfield simplified it all, offering smaller tax credits for capital investments and adding in some time limits. Crucially, the incentives could only be accessed once companies built their facilities and hired employees, and there were clawbacks if companies didn’t keep their promises.
It was a risk, but Alabama didn’t feel as desperate anymore. “We felt like we could win most of the time based on having available sites, available work force, good business climate, low taxes and speed to market,” Mr. Canfield explains from the office of Burr & Forman LLP in Birmingham, where he is now a managing director of economic development. The last point was key. When companies invested in Alabama, they could receive permits and begin construction quickly. Red tape was for suckers.
A prototype of a Mercedes-Benz Electric SUV is displayed at the automaker’s battery pack plant in Bibb County, Ala., in March, 2022.Reuters
Another signature achievement of his: putting together a marketing campaign for the state. “Whenever I had travelled around the world, nobody knew where Alabama was,” he says. “If they’d heard of it, it wasn’t a positive image.” He hired a branding agency and launched a campaign called “Made in Alabama.” Reminiscing, he pulls up the old slide deck on his iPad, grinning like a proud father.
At the local level, Huntsville deployed a similar approach. When Mayor Battle won his first election, in 2008, “we had great entry-level jobs. Hospitality, landscaping, etc.,” he says. “And we had great jobs on the top end, which was, you know, your rocket scientist, your technical person, your doctorate people who worked out at Redstone Arsenal. That middle ground was where our work force was lacking.”
Huntsville targeted its incentives toward this sector. Its first big win, in 2014, was a new plant for Remington Outdoor Co., the rifle maker. (Some stereotypes don’t die.) Soon afterward, Polaris Inc. arrived, opening a plant to produce its auto-cycle, the Slingshot, and an off-road utility vehicle, the Ranger. Then GE Aviation arrived, and then after that, Aerojet Rocketdyne, which now produces solid rocket motors in Huntsville.
The city also leaned into its expertise. After the Second World War, the U.S. government brought over German engineers who’d developed aircraft, rockets and missiles for the Nazis. This group eventually settled in Huntsville and worked out of Redstone Arsenal. (Despite their pasts, the U.S. decided it was more important to win the budding Cold War with the Soviets.) The scientists, led by Wernher von Braun, went on to develop the Saturn rockets used for America’s missions to the moon. It’s why Huntsville is now known as Rocket City.
All this innovation seeped into the city’s mindset. In 2004, two benefactors, the late Lonnie McMillian, a telecommunications executive, and Jim Hudson, a businessman who’d founded Research Genetics, a company that helped map the human genome, used their money to seed a life sciences ecosystem. To lead it, they hired the former director of Stanford University’s Human Genome Center.
The guiding hope was that one day the campus would attract world-class organizations. HudsonAlpha is now home to 40 biotech companies, and its home run came in December, when Eli Lilly came to town.
Robert Sbrissa has seen the boom up close. Originally from Montreal, he and his wife, Monica, moved to Birmingham in 1996 with two young kids. The financial software company he worked for was based in the U.S., and it asked him to move down. The family mulled it over, then bit. “It was a day in March that snowed about 15 inches in Montreal and I said, ‘Let’s give it a shot.’” The couple assumed they’d do a two-year stint. This August, it’ll be 30 years in Alabama.
Over dinner at the golf and country club in Greystone, the affluent neighbourhood where his family now lives, Mr. Sbrissa says their experience is a common one. “You get people who move here for work … and not a lot of people leave.“
First, the U.S. simply pays more for many senior white-collar jobs, and top personal tax rates in Alabama can be around 40 per cent. Today, they’re 53.5 per cent in Ontario. The size of the U.S. economy is also breathtaking – and companies make decisions faster. It’s a dream for someone in sales.“The entrepreneurial spirit was like nothing I had seen or experienced before,” he says.
Mr. Sbrissa walks through the golf course in Greystone, the affluent neighbourhood where his family now lives.Charity Rachelle/Supplied
Daily life was also a joy. Neighbours really are friendly in the South; the kids went to public schools equivalent to top private schools in Canada; and because the family could afford it, the health care is fantastic. Mr. Sbrissa recently got a magnetic resonance imaging scan within days.
As for Birmingham itself, there’s the beauty of the rolling hills, which deliver stunning fall foliage. And the city’s becoming a foodie hub. A new restaurant, Bayonet, was named one of America’s 50 best restaurants by The New York Times last fall. And despite the bible thumping, Birmingham has a sizable LGBTQ+ community and scored the same as Boston on the Human Rights Campaign’s Municipal Equality Index.
There is a “but.” The metro area, Mr. Sbrissa says, has noticeable income divisions. The public high school his son went to had a football field that installed the same turf as Gillette Stadium, the home of the New England Patriots. “You go 25 miles down the road and these kids don’t have books,” he says.
The way schools are funded is part of the problem. A good chunk of the money comes from town property taxes, In Greystone, the average list price for a home is currently US$1.5-million. In Woodlawn, which is close to the downtown core, it’s US$230,000. Alabama also has low property tax rates that average just 0.4 per cent annually, the second-lowest in the country. When they are multiplied by house prices, poorer areas have much less money to pay for quality teachers. It’s baked-in inequality that exists across much of the U.S.
Structural issues such as these leave a long tail of destruction, something Mashonda Taylor, chief executive officer of a community organization called Woodlawn United, is trying to combat.Woodlawn used to be a thriving middle-class community, but people fled after the Civil Rights Era and after the steel business in town petered out.
To rebuild, Woodlawn is using a multiprongedapproach: adding mixed-income housing; emphasizing public safety and green spaces; beefing up education opportunities, such as a subsidized early learning centre; and helping residents land stable, well-paying jobs. But the dire state of the community’s schools makes a rebirth that much more complicated. She sees residents in their 20s who struggle to break the cycle of poverty. “They didn’t learn how to read. Or do basic math,” she says. “So, you can’t get a higher-quality job.”
It’s often even worse in rural areas, which make up 42 per cent of the state’s population. Within the Appalachian Region, 26 per cent of adults read below third-grade level, and 40 per cent of adults struggle to solve math problems that require more than one step, according to the Appalachian Learning Initiative.
As for health care, in 2025 the Commonwealth Fund, a foundation that conducts independent research, ranked Alabama 42nd out of the 50 states for its overall health system performance. In rural areas, hospitals are having trouble simply staying open.
There are many ways to slice and dice the data to show how Alabama is far behind Canada when it comes to overall health, but one statistic sums it up. For all the investment dollars that Alabama has brought in, the state’s life expectancy is still just 74 years, the fourth-lowest in the U.S. In Canada, it’s 82 years, one of the highest worldwide.
All these nuances – the income disparity, the life expectancy, the kids who can’t read – epitomize why Jim Stanford, a veteran economist, is so mystified by the recent obsession with per capita GDP. The metric, he says, doesn’t capture what the average person receives from a country’s production.
He breaks down the formula to explain his point. There are multiple ways to calculate GDP, but he likes to use the income approach, which adds up everything earned in the economy – wages, profits and investment income. Mr. Stanford says only about half of GDP is paid to workers; much of the rest comes from corporate profits and investment income, and they mostly flow to the wealthy as shareholders.
To his mind, Ireland illustrates this problem best. By the IMF’s calculations, Ireland has the third-highest per capita GDP in the world, around US$150,000. Mr. Stanford says that is divorced from reality. “I’ve slung a Guinness or two in an Irish pub. Great country. Friendly people. Not rich,” he says. Ireland’s figure is skewed because many global companies book their international profits there, owing to the country’s low corporate tax rate.
As for the second component in the GDP per capita calculation – population – Canada’s soared by two million people in 2023 and 2024. That’s much faster than the equivalent U.S. growth rate on a percentage basis. It takes time for all these newcomers to start materially boosting GDP and offset their drag on the per capita number.
What, then, are Canadians to make of all this?
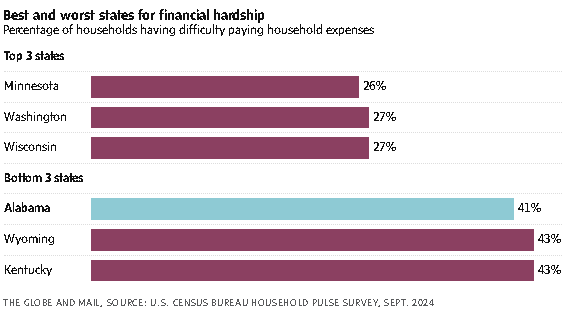
To start, per capita GDP isn’t the be-all and end-all. In Alabama, tens of billions of dollars of direct investment have poured in over the past decade, but the state’s minimum wage is still just US$7.25. Not every worker benefits. In fact, Alabama recently ranked as the third-worst state for financial hardship, according to official U.S. government data, with 41 per cent saying they had a somewhat difficult or very difficult time making ends meet.
Per capita GDP also doesn’t reflect social values. Canada has a high rate of unionization, which many people love. Meanwhile, Alabama has a total abortion ban except in dire health scenarios.
But there are things to learn from the South. Mr. Canfield, the former commerce secretary, can’t emphasize it enough: For businesses, speed to market matters. Companies that put capital at risk want to earn back those investment dollars as quickly as possible.
In Canada, Prime Minister Mark Carney has floated the possibility of a new pipeline from Alberta to the Pacific Ocean, but just this week, Enbridge Inc. said it won’t touch the project because it can’t sink more money into something that may never see the light of day.
Alabama’s evolution also poses a somewhat existential question for Canadians: In a competitive, global market, why should companies invest in the Great White North?
Last fall, there was an uproar in Ontario because Stellantis NV, the automaker, said it would shut a plant in Brampton, Ont. The timing, tied to U.S. President Donald Trump’s tariff regime, dominated headlines. But what got lost is that Brampton, a suburb of Toronto, is now a very expensive place to live, with an average detached home price of $1.05-million. The union that representsStellantis workers has to fight for higher wages, and that makes the plant less profitable for the company.
Think about it from a CEO’s vantage point: If workers in Canada are more expensive, they should provide value over and above what a newly-trained – and cheaper – work force in Alabama can offer, especially considering there is now also an entire auto parts supplier network in Alabama and a major port nearby in Savannah, Ga., that’s bigger than any in Canada.
To Canada’s credit, it isn’t exactly standing still. One of Prime Minister Carney’s first moves last year was to establish a Major Projects Office to streamline regulatory reviews for projects that Ottawa deems to be in the national interest. Bye-bye red tape.
But the federal government can’t solve every problem. Over the years, there has been report after report on how to make Canada’s economy more vibrant. Boost interprovincial trade. Tap Canada’s highly educated work force to fuel the innovation sector. Recruit skilled immigrants. Canadians have the answers, and yet, somehow, nothing really changes.
Why is that? In 2007, one of these reports was commissioned by Stephen Harper’s government, and the authors, led by Red Wilson, came to this conclusion: “Canadians do not perceive that there is an imminent crisis.” Canadians certainly don’t want the country to fall behind as more nimble and aggressive competitors rise, the authors added, but they “do not appear to have a view about what needs to be done to avoid this outcome.” If Ottawa commissioned yet another report today, its conclusion could easily be the same.
So, yes, Canadians should take it all with a grain of salt. Alabama has its flaws. Per capita GDP does, too. But there is a glaring lesson in the Deep South: If Canadians remain complacent, the rest of the world will eat our lunch.
Oil prices rose about 2% on Thursday to their highest in six months, as traders worried about tensions between the U.S. and Iran, which stepped up military activity in the oil-producing Middle East.
Brent futures were up $1.23, or 1.8%, to US$71.58 a barrel at 1551 GMT. U.S. West Texas Intermediate (WTI) crude was up $1.34, or 2.1%, at US$66.53.
After advancing more than 4% on Wednesday, Brent is on track to close at its highest since July 31, while WTI is on track for its highest close since August 1.
Oil prices got a boost from “geopolitical tensions and the worry that the U.S. is going to strike (Iran) in the near future,” said Andrew Lipow, president of Lipow Oil Associates. “The market will continue to rally in anticipation of something happening.”
Iran planned a joint naval exercise with Russia on Thursday, Iran’s semi-official Fars news agency reported, days after the country shut down the Strait of Hormuz for a few hours for military drills. The Strait is a vital link for trade, with about 20% of global oil supply passing through it.
President Donald Trump said the U.S. had to make a meaningful deal with Iran.
“Good talks are being had. It’s proven to be, over the years, not easy to make a meaningful deal with Iran. We have to make a meaningful deal, otherwise bad things happen,” Trump told the first meeting of his Board of Peace in Washington.
The U.S. has deployed warships near Iran, with U.S. Vice President JD Vance saying Washington was considering whether it should continue diplomatic engagement with Tehran or pursue another option.
Iran issued a notice to airmen that it planned rocket launches in areas across the south of the country on Thursday, according to the U.S. Federal Aviation Administration website.
Some countries have asked their residents to leave Iran.
Separately, crude oil exports from Saudi Arabia, the world’s largest oil exporter, fell to 6.988 million barrels per day, its lowest since September, data from the Joint Organizations Data Initiative showed on Thursday. Earlier this month, Reuters reported that OPEC+ was leaning toward a resumption in oil output increases from April.
OPEC+ includes the Organization of the Petroleum Exporting Countries and other producers like Russia.
Two days of peace talks in Geneva between Ukraine and Russia ended on Wednesday without a breakthrough, with Ukrainian President Volodymyr Zelenskiy accusing Moscow of stalling U.S.-mediated efforts to end the four-year-old war.
U.S. crude and gasoline and distillate inventories fell last week, market sources said, citing American Petroleum Institute figures on Wednesday. That was contrary to expectations in a Reuters poll that crude stocks would rise by 2.1 million barrels in the week to February 13. Oil prices were up despite the Director of the International Energy Agency saying that oil demand growth is less than one million barrels per day and that a substantial surplus was expected.
Official U.S. oil inventory reports from the Energy Information Administration are due at noon.
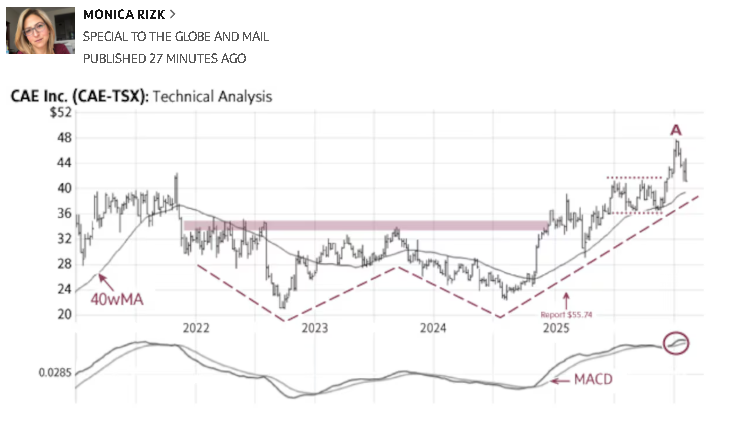
CAE (CAE-T +0.97%increase, Friday’s close $41.20) formed a bullish technical base in the shape of a “W” pattern (dashed lines). On March 13, 2025, at $34.18, we identified a breakout above the neckline of this formation (shaded area) and provided an initial upside target of $43. The stock subsequently advanced to a July high of $41.22 (A) before consolidating within a narrow range between $36 and $41 (dotted lines). The recent rise above this consolidation range signals a fresh breakout, completes and exceeds our previously identified target, and confirms the continuation of the longer-term uptrend (B).
Technical indicators, including the rising 40-week moving average (40wMA), continue to support the bullish outlook. Only a sustained decline below the $39 area would be viewed as negative.
Point & Figure measurements provide a target of $52.
The large “W” pattern (dashed lines) continues to support higher targets.
Statistics Canada says lower prices at the pump and easing shelter inflation helped rein in the pressure facing consumers in January.
The agency said Tuesday that the annual rate of inflation ticked down to 2.3 per cent last month. Economists had expected inflation to hold steady at 2.4 per cent.
Statscan said gas prices were 16.7 per cent lower year-over-year in January, largely thanks to the end of the consumer carbon price in April.
That decline helped offset food inflation, which accelerated to 7.3 per cent annually in January.
Statscan said a jump of 12.3 per cent in the cost of restaurant meals year-over-year drove the increase.
That surge was mostly tied to the federal government’s “tax holiday” taking full effect a year earlier. January, 2025, marked the only full month of Ottawa’s temporary tax reprieve, which removed a portion of the sales tax on dining out and a variety of goods, and annual comparisons are somewhat distorted as a result.
Prices for alcohol, children’s clothes, toys and games also jumped year-over-year due to the “tax holiday” effect.
Costs for food from the grocery store, meanwhile, rose 4.8 per cent annually in January, slowing from a price hike of five per cent in December. Statscan said prices for fresh fruit fell 3.1 per cent in the month as stable growing seasons in producer regions eased prices for berries, oranges and melons.
Shelter inflation – long a stubborn fuel in the consumer price index – also continued its easing path to start the year.
Slower price growth for rent and mortgage interest costs meant shelter prices rose 1.7 per cent annually in January, the first time in almost five years this figure has been below two per cent.
Leslie Preston, TD senior economist, said in a note to clients Tuesday that the January inflation report is consistent with the bank’s view that price pressures will continue to moderate through the year “as past inflation problem areas, like rents, continue to cool.”
Preston said the Bank of Canada’s measures of underlying inflation cooled in January and core metrics were running below the central bank’s two per cent target on a three-month basis.
Statscan’s January price report marks the Bank of Canada’s first look at inflation data since the central bank held its benchmark interest rate steady at 2.25 per cent last month.
BMO chief economist Doug Porter said in a note to clients Tuesday that progress on the central bank’s preferred core inflation metrics in January will be encouraging.
He said the bar for the bank to cut its policy rate again is high as central bank officials warn there is little more monetary policy can do to support the economy through its trade-driven structural transition.
Porter also argued an eventual cut isn’t completely off the table.
“Even so, if inflation continues to decelerate, the bank could be in position to support the economy should growth truly struggle as it undergoes a structural shift,” he said.
The Bank of Canada will get another look at inflation dynamics for February before its next decision on March 18.
Canada’s two largest insurers beat analysts’ profit expectations for the last quarter of 2025 as the industry continues to show broad resilience to U.S trade wars and market volatility.
Both Sun Life Financial Inc. SLF-T +0.32%increase and Manulife Financial Corp. MFC-T +2.81%increase ended the year with strong profit gainsacross both their asset management divisions and individual and group life insurance sales.
Sun Life reported “underlying” net income of $1.09-billion or $1.96 a share for the quarter ended Dec. 31. The company earned $965-million or $1.68 a share in the same period of 2024.
Manulife also reported a jump in its fourth-quarter “core earnings” to $2-billion or $1.12 a share, compared with $1.91-billion or $1.03 a year earlier. The insurer also announced a 10-per-cent increase to its dividend to 49 cents per common share.
Both insurers emphasize versions of earnings that strip out investment losses and make other accounting adjustments. Manulife calls its figure “core earnings,” while Sun Life describes its as “underlying net income.”
Sun Life and Manulife both beat analysts’ expectations, which were set at $1.87 a share and $1.06 a share, respectively, according to an RBC Capital Markets report.
The surge in profit came during a year that saw the U.S. trade war increase investor concerns and spark market volatility. But Sun Life chief executive officer Kevin Strain said the geopolitical risk has not yet created “big economic impacts” to the broader economy, which would affect insurers much more.
“Inflation is not much more despite the tariffs, equity markets have grown despite everything that’s going on, credit has been relatively benign and interest rates are almost favorable to the insurance industry,” Mr. Strain said in an interview with The Globe.
Mr. Strain – who travels frequently in his role – said he has seen a lot of interest around the world to work with Canada. In recent months, he has been able to join several trade missions with the federal government and the Business Council of Canada, including a trip in October with Prime Minister Mark Carney to Malaysia and a separate trip with the Business Council to Japan.
Sun Life shares rose 6.3 per cent to $93.64 on Thursday as the insurer saw gains in Canada, Asia and the U.S. business segments, and are up 10.5 per cent from a year prior.
Manulife shares, meanwhile, slumped 5.2 per cent to $48.70, but are up 15.2 per cent from a year ago.
The fall in Manulife’s share price followed news that U.S. core earnings for its U.S business had dropped to US$229-million for the quarter, compared with US$294-million for the same period in 2024.
In an interview, Manulife chief financial officer Colin Simpson said the earnings shrinkage in the United States was owing to unfavourable life insurance claims for the region, specifically among high-net-worth clients.
Despite the U.S insurance segment – which he says is expected to improve in 2026, Mr. Simpson said insurers are often a place “where people have found comfort” during difficult times as the sector has been “attractively valued for a long time.”
“When we started the year with all the geopolitical noise around tariffs, it definitely felt like we were in for a world of volatility,” he said in an interview. “But we had a fantastic year from both a performance perspective and also from a share price perspective.”
Similar to its competitors, Mr. Simpson said Manulife makes the vast majority of its money from existing income streams and therefore is not linked to sales volatility that can occur in other industries, such as banking or property and casualty insurance.
However, despite record earnings for the quarter, both insurers saw U.S retail investors in their investment fund operations start to move money out of U.S. equities.
Mr. Simpson said the recent shift in market sentiment was largely owing to actively managed funds that were underweight in the Magnificent Seven – a group of high-performing technology companies such as Apple, Amazon and Microsoft.
The weaker performance, he said, moved a lot of retail investors into more passive index funds such as exchange-traded funds, while some steered their investments into safer havens such as cash.
Great-West Lifeco, the parent company of Canada’s third-largest insurer, Canada Life, also reported fourth-quarter earnings late Wednesday. Great-West reported earnings of $1.2-billion or $1.36 a share. That is up from $1.1-billion or a $1.20 a share a year earlier.
Editor’s note: An earlier version of this story incorrectly said the recent shift in market sentiment was largely owing to actively managed funds that were affected by the underperformance of the Magnificent Seven. The current version has been updated to say the shift in market sentiment was due to actively managed funds being underweight in the Magnificent Seven. An earlier version also quoted Manulife’s U.S. business core earnings as net income. That reference has been corrected.
Canadian pipeline operator TC Energy TRP-T +3.51%increase beat analysts’ estimates for fourth-quarter adjusted profit on Friday, helped by record natural gas flows across its North American network and increased demand for natural gas and power.
Major pipeline operators such as TC Energy are doubling down on expectations of surging natural gas demand as LNG export facilities expand and power-hungry AI systems, cryptocurrency miners and data centers ramp up electricity use.
TC Energy operates a 58,100 mile-long network of pipelines, supplying more than 30 per cent of the clean-burning fuel consumed daily across North America.
The company placed $8.3-billion of projects into service in 2025, and expects to place nearly $4-billion of capital into service this year.
In January, it closed a non-binding open season for 0.5 billion cubic feet per day (bcfpd) on its Columbia Gas Transmission system near Columbus, Ohio, attracting 1.5 bcfpd of total bids, three times the proposed project capacity, as power demand from data centers surged.
The company anticipates full-year capital expenditure to be between $6.0-billion and $6.5-billion.
Canadian natural gas pipeline deliveries averaged 27.2 bcfpd during the quarter, up 5 per cent from a year earlier, while U.S. pipeline flows rose 9.5 per cent to 29.6 bcfpd.
Deliveries to LNG facilities jumped 21 per cent to 3.9 bcfpd.
TC Energy’s adjusted core profit at U.S. natural gas pipelines, its largest segment, rose to $1.39-billion, from $1.2-billion a year ago.
Adjusted core earnings from Canadian natural gas pipelines rose nearly 13 per cent to $961-million during the quarter.
On an adjusted basis, the Calgary-based company earned 98 Canadian cents per share, compared with analysts’ average expectations of 92 Canadian cents, according to data compiled by LSEG.
It raised the quarterly dividend by 3.2 per cent to $0.8775 per share, marking its twenty-sixth straight year of dividend growth.
Magna International Inc.’s MG-T +18.94%increase share price rose by 18 per cent on Friday after the Aurora, Ont., auto parts maker forecast steady sales for 2026, buoyed by new assembly work for Chinese electric carmakers.
Magna finance chief Phil Fracassa said global auto production is expected to be flat this year, but new contracts to make electric cars in Europe for China’s Xpeng and GAC will help lift the company’s sales.
Magna began assembling the EVs for Xpeng and GAC late last year at its Magna Steyr plant in Graz, Austria, which has produced more than four million vehicles for Mercedes, BMW and other brands. The Chinese companies are increasingly selling EVs in Europe and turned to Magna to produce domestic supplies.
“Looking ahead, this should continue to represent a growth opportunity for our complete vehicles business,” Mr. Fracassa said.
In a conference call with analysts on Friday, Mr. Fracassa said Magna is forecasting sales this year of between US$41.9-billion and US$43.5-billion, or nearly flat to a 3.5-per-cent increase over 2025.
Magna, which has plants around the world, will also benefit from increased vehicle production in Europe and a weaker U.S. dollar, Mr. Fracassa said on the call, held before markets opened to discuss fourth-quarter and full-year results for 2025. Those factors should outweigh an expected slip in production in China and North America, he said, as Magna ends production of the Toyota Supra and BMW Z4 in Graz.
For 2026, Magna forecasts adjusted profit per share will be between US$6.25 and US$7.25. This is higher than analysts’ estimates of US$5.99, according to LSEG, a financial data company.
Stock analyst Michael Ward of Citigroup said the guidance points to an earnings before interest, taxes and depreciation margin with a midpoint of 10 per cent, Magna’s best since 2021.
For 2025, Magna said its profit fell by 20 per cent to US$829-million or US$2.93 a share, compared with US$1-billion (US$3.52) in 2024. Revenue fell by 2 per cent to US$42-billion, compared with 2024.
For the fourth quarter of 2025, Magna lost US$1-million, down from a profit of US$203-million in the same period a year earlier. Revenue rose by 2 per cent to $10.8-bilion, from the year-ago quarter.
Magna and other automotive companies have been hit by U.S. President Donald Trump’s tariffs in the past year, causing manufacturers to absorb billions in costs. At the same time, carmakers in North America have taken billions in writeoffs for EV investments as demand has slowed amid U.S. rollbacks of purchase incentives and other regulations.
Swamy Kotagiri, Magna’s chief executive officer, said the company has offset the impact of almost all the tariffs, recovering them from customers.
In the European Union, battery-electric and hybrid-electric cars captured 17 per cent and 14 per cent of the market, respectively, according to the European Automobile Manufacturers’ Association.
Enbridge ENB-T beat expectations for fourth-quarter profit on Friday, and said it had sanctioned several projects to help meet surging demand for power across North America.
Pipeline operators are benefiting from a surge in demand for natural gas, driven by liquefied natural gas exports, and soaring power generation tied to increased use of artificial intelligence and data centers.
Earlier in the day, peer TC Energy also beat market expectations for quarterly profit on the back of rising natural gas demand.
Enbridge said it had C$39 billion (US$28.63 billion) in project backlog, C$8 billion of which is expected to come into service this year.
The company sanctioned two renewable energy projects in the fourth quarter – a $1.2 billion project in Wyoming for a large tech company, and an onshore wind project in Texas worth US$400 million to support Meta Platforms’ data center operations.
“We continue to advance over 50 data center opportunities across North America, requiring up to 10 billion cubic feet per day new takeaway capacity,” CEO Greg Ebel said, adding that the company expects to sanction additional projects in 2026 and beyond.
Shares of the company rose nearly 3% to an all-time high of C$72.57.
Enbridge posted an adjusted profit of 88 Canadian cents per share for the fourth-quarter, compared with estimates of 77 Canadian cents, according to data compiled by LSEG.
UBS analyst Manav Gupta said Enbridge “continues to prioritize balance sheet strength… while still looking into low-multiple brownfield opportunities and utility-like growth.”
The results come as the North American energy industry braces for an increase in Venezuelan oil production, which could further pressure Canadian oil prices as the country’s companies sell a similar heavy oil, analysts have said.
However, Ebel said the company does not expect any material impact from the recent geopolitical events involving Venezuela, adding that increased output from the country would be a supplement to Canadian heavy crudes, not a replacement.