Category: Uncategorized

  • RTMA Mar 16: SHOPIFY Inc. (SHOP.TO)

    Executive Summary

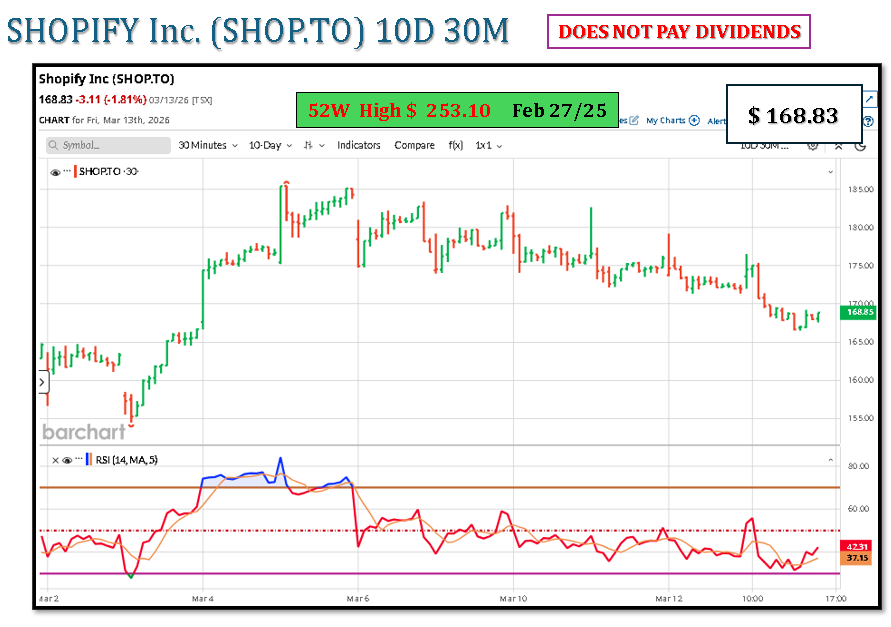
    • Shopify (SHOP.TO) declined modestly over the last ~10 trading days mainly due to valuation compression and volatility in high-growth technology stocks, not a collapse in fundamentals.
    • The stock has been sensitive to AI-related software sector fears and margin concerns after earnings, which triggered selling across software names.
    • Shopify still trades at very high valuation multiples (~140× earnings), making it vulnerable to short-term corrections.
    • Technical levels: support roughly C$150–155, resistance C$170–175.
    • Analysts maintain “Buy / Moderate Buy” consensus with 12-month targets around C$210–225+ depending on the estimate.

    1. What Caused the 10-Day Share Price Decline

    1. Valuation Compression

    Shopify is one of the most expensive large-cap TSX stocks.

    MetricApproximate Level
    Market cap~$170B
    P/E ratio~140×

    High-multiple stocks tend to decline when:

    • interest-rate expectations change
    • investors rotate toward value sectors
    • growth expectations moderate

    Because of this, price declines often occur without fundamental deterioration.


    2. Software Sector Volatility

    Technology stocks have been volatile due to concerns that AI-driven software disruption and margin pressure could affect profitability.

    Specific issues cited by analysts:

    • AI spending could reduce near-term margins
    • uncertainty about agentic AI commerce platforms competing with Shopify

    These fears triggered broader selling in software equities.


    3. Post-Earnings Volatility

    Shopify’s latest results were mixed:

    MetricResult
    Revenue growth~31% YoY
    EPSslightly missed expectations

    Despite strong revenue growth, the earnings miss and margin outlook caused a ~6–7% drop in the stock after the report.

    High-growth tech stocks frequently move sharply when earnings differ from expectations.


    4. Profit-Taking After Strong Multi-Year Gains

    Shopify had already risen significantly in previous years and outperformed many markets.

    After strong rallies, institutional investors often:

    • rebalance portfolios
    • trim high-beta technology exposure

    This contributes to short-term pullbacks even during long-term growth trends.


    2. Technical Structure

    Approximate levels derived from recent trading ranges and moving averages.

    LevelPrice (CAD)Interpretation
    Major resistance175–180recent swing highs
    Near resistance170–175short-term supply zone
    Pivot160–165recent consolidation
    Near support150–155short-term support
    Major support140–145trendline / moving average

    The stock remains above long-term support but below recent highs, indicating consolidation.


    3. Analyst Forecasts

    Consensus analyst expectations remain positive.

    MetricEstimate
    Average 12-month target~C$209–225
    High estimate~C$250–300
    Low estimate~C$157–190
    Consensus ratingBuy / Moderate Buy

    These estimates imply ~30–50% potential upside depending on the model used.


    4. Scenario Outlook

    3-Month Outlook

    ScenarioPrice RangeDrivers
    Bear140–150tech sector selloff or valuation compression
    Base150–175consolidation after earnings
    Bull175–190tech momentum return / strong growth data

    Most likely outcome: volatile range trading due to tech-sector sensitivity.


    12-Month Outlook

    ScenarioPrice RangeDrivers
    Bear130–150growth slowdown or software sector repricing
    Base200–225continued revenue growth (~20%+)
    Bull230–260+strong AI commerce adoption and margin expansion

    Growth forecasts remain strong:

    • ~18% revenue growth per year
    • ~20–25% EPS growth expected by analysts.

    5. Key Risks

    Valuation

    • extremely high P/E multiple

    Technology competition

    • new AI-driven commerce platforms

    Profitability

    • heavy spending on AI and infrastructure

    Market

    • rotation out of growth stocks.

    6. What Would Change the Outlook

    Bullish catalysts:

    • faster adoption of AI commerce tools
    • stronger merchant growth
    • expanding enterprise clients.

    Bearish catalysts:

    • slowing revenue growth
    • margin compression from AI investment
    • broad technology sector correction.

    Bottom line:
    The recent ~10-day decline in SHOP.TO is largely a valuation-driven pullback and tech-sector volatility, not a collapse in the company’s growth trajectory. Current data suggests short-term trading between ~C$150–175, while analyst forecasts still point to ~C$210–225+ over the next 12 months if growth expectations hold.

  • RTMA Mar 16: Loblaw Co (L.TO)

    Executive Summary

    • Loblaw Companies Limited (TSX: L) declined modestly over the last ~10 trading days mainly due to profit-taking after earnings and negative sentiment from a revenue miss and a cybersecurity incident.
    • The latest quarter beat EPS expectations but missed revenue forecasts, which triggered a short-term stock drop.
    • Additional pressure came from news that the company is investigating a data breach involving basic customer data, although no financial impact is expected.
    • Analysts still rate the stock “Buy”, with a 12-month target roughly C$63–68 depending on the source.
    • Near-term outlook: sideways consolidation, consistent with defensive consumer-staples valuations.

    1. What Caused the Share Price Decline (Last ~10 Days)

    1. Revenue Miss in Latest Earnings

    The company’s latest quarterly results showed:

    MetricResultMarket Reaction
    Adjusted EPSBeat estimatesPositive
    RevenueC$16.38B vs C$16.77B expectedNegative

    Weak revenue reflected cautious consumer spending amid inflation and rising living costs, which weighed on investor sentiment.

    After the report, the stock fell roughly ~5% in the immediate reaction, reflecting concerns about sales growth despite strong margins.


    2. Cybersecurity Incident

    A separate catalyst during the past week:

    • Loblaw disclosed it is investigating suspicious activity and a data breach involving customer information.
    • The company said credit cards and passwords were not compromised and financial impact is unlikely, but the event created short-term sentiment risk.

    Even if financially immaterial, cybersecurity incidents often create temporary valuation pressure.


    3. Profit-Taking After a Strong Run

    Longer-term performance:

    PeriodReturn
    1-year~33%
    5-year~285%

    After large multi-year gains, institutional investors often reduce exposure following earnings events, contributing to short-term declines.


    2. Technical Structure

    Approximate recent price levels based on current trading ranges.

    LevelPrice (CAD)Interpretation
    Major resistance67–68Recent post-earnings high
    Near resistance65–66Short-term supply zone
    Pivot63–64Current consolidation area
    Near support61–62Recent lows
    Major support58–60Longer-term trend support

    Technical context:

    • the stock has fallen in several of the last 10 sessions but remains above major trend support.

    3. Analyst Forecasts

    Consensus estimates

    MetricValue
    Average target~C$63–68
    High estimate~C$75
    Low estimate~C$39–43
    RatingBuy (majority)

    Interpretation:

    • Current price is close to consensus fair value, limiting short-term upside.

    4. Scenario Outlook

    3-Month Outlook

    ScenarioPrice RangeDrivers
    Bear58–61consumer spending slowdown
    Base61–66consolidation after earnings
    Bull66–70strong same-store sales growth

    Most likely: sideways trading, typical for defensive staples.


    12-Month Outlook (Analyst-Based)

    ScenarioPrice RangeDrivers
    Bear55–60margin compression or weaker food sales
    Base65–70steady earnings growth
    Bull70–75stronger same-store sales + valuation expansion

    Consensus forecasts imply single-digit to low-teens upside.


    5. Fundamental Drivers

    Key earnings drivers for Loblaw:

    DriverImpact
    Same-store grocery salesCore revenue growth
    Discount banner growth (No Frills, Maxi)Volume resilience
    Pharmacy segmentHigher margin expansion
    Consumer spending trendsTraffic and basket size

    The company still expects high-single-digit annual EPS growth, consistent with analyst projections.


    6. Key Risks

    Operational

    • grocery margin pressure
    • supplier cost inflation

    Consumer

    • weaker discretionary spending

    Reputational

    • cybersecurity incident fallout

    Market

    • rotation away from defensive sectors.

    7. What Would Change the Outlook

    Bullish catalysts:

    • stronger same-store food sales
    • higher pharmacy growth
    • consumer spending recovery.

    Bearish catalysts:

    • prolonged consumer weakness
    • margin compression in grocery retail.

    Bottom line:
    The recent ~10-day decline in L.TO is primarily due to short-term sentiment after a revenue miss, cybersecurity headlines, and profit-taking following a strong multi-year rally. The stock currently appears to be consolidating around fair value (~C$63–66), with analyst-based 12-month targets generally in the C$65–70 range unless earnings expectations change materially.

  • RTMA Mar 16: George Weston Limited (WN.TO)

    Executive Summary

    • George Weston Limited (TSX: WN) declined modestly over the past ~10 trading days primarily due to valuation compression and short-term consolidation after a strong 12-month rally (~20%).
    • The stock currently trades around ~C$95–97, below the 52-week high ~C$104.5.
    • The company trades at a relatively high earnings multiple (~37×) for a mature food-retail holding structure, prompting some near-term profit-taking.
    • Technical levels: support C$93–95, resistance C$100–104.
    • Analyst consensus implies ~13–18% 12-month upside, with targets around C$109–112.

    1. Drivers of the 10-Day Share Price Decline

    1. Valuation Pressure After Strong Run

    Over longer horizons the stock has delivered strong returns:

    PeriodPerformance
    1-year total return~19–20%
    5-year total return~3×

    However:

    • WN recently traded at ~37× earnings, above typical defensive retail valuations.
    • This elevated valuation increases short-term sensitivity to profit-taking.

    2. Consolidation After Approaching 52-Week High

    The stock recently traded near the top of its annual range.

    MetricValue
    Current price~C$97
    52-week high~C$104.5
    52-week low~C$75.1

    Stocks often pause or pull back after approaching highs due to:

    • portfolio rebalancing
    • momentum exhaustion

    3. Holding-Company Discount and Loblaw Exposure

    WN’s value is largely tied to two assets:

    AssetRole
    Loblaw Companies LimitedMajority ownership (~50%+ economic exposure)
    Choice Properties REITLarge real estate portfolio

    The market frequently applies a holding-company discount to WN’s sum-of-parts valuation.
    Analysts have noted that this discount limits short-term upside despite strong operating assets.


    4. Defensive Sector Rotation Moderating

    Consumer staples stocks rallied earlier as defensive assets.
    As market sentiment shifts, investors may temporarily rotate capital back to cyclicals, reducing short-term demand for staples equities.


    2. Technical Structure

    Key Support and Resistance

    LevelPrice (CAD)Interpretation
    Major resistance102–10452-week high zone
    Near resistance99–100Recent rally peak
    Pivot96–97Current consolidation area
    Near support93–95Recent buying zone
    Major support90–92Trendline support

    Current structure: neutral consolidation above long-term trend support.


    3. Analyst Forecasts

    Consensus Ratings

    • Rating: Moderate Buy
    • Analyst coverage: ~5–8 analysts

    Price Target Distribution

    MetricCAD
    Average target~109–112
    High estimate~121–127
    Low estimate~98–103

    This implies roughly 10–18% potential upside from current levels.


    4. Scenario Analysis

    3-Month Outlook

    ScenarioPrice RangeDrivers
    Bear90–93broader TSX risk-off, retail margin pressure
    Base93–100consolidation near fair value
    Bull100–105continued earnings growth at Loblaw

    Probability: Base scenario (sideways consolidation).


    12-Month Outlook

    ScenarioPrice RangeDrivers
    Bear85–95food retail margin compression
    Base105–112steady earnings growth + narrowing holdco discount
    Bull115–125Loblaw expansion and valuation rerating

    Consensus aligns closest to the C$108–112 range.


    5. Valuation Context

    MetricValue
    P/E~25–37 (varies by metric)
    Dividend yield~1–1.3%
    Market cap~C$37B

    Interpretation:

    • WN trades as a defensive consumer staple asset.
    • Growth expectations are modest but stable.

    6. Key Risks

    Operational

    • grocery margin pressure
    • wage and energy cost inflation

    Structural

    • persistent holding-company valuation discount

    Market

    • rotation away from defensive sectors

    7. What Would Change the Outlook

    Bullish catalysts:

    • narrowing holding-company discount
    • stronger Loblaw earnings
    • real-estate value realization

    Bearish catalysts:

    • regulatory pressure on grocery pricing
    • margin compression in food retail.

    Bottom line:
    The recent ~10-day decline in WN is mainly technical consolidation and valuation pressure after a strong multi-year run, not a deterioration in fundamentals. Current data supports a short-term trading range of ~C$93–100, with analyst-based 12-month targets around ~C$109–112 unless earnings expectations change materially.

  • RTMA Mar 16: Saputo Inc. :  (SAP.TO)

    Executive Summary

    • Saputo (SAP.TO) has declined slightly over the last ~10 trading days mainly due to technical consolidation after a strong multi-month rally (~70% over 12 months).
    • The pullback also reflects mixed earnings signals: EPS beat expectations but revenue missed forecasts in the latest quarter.
    • Technical levels indicate support around C$41–42 and resistance near C$44.
    • Analyst consensus implies limited upside, with a 12-month target around C$44–45 from a current price near ~C$42.
    • Short-term outlook: range-bound consolidation, unless earnings estimates are revised.

    1. Drivers of the Recent Share Price Decline (Last ~10 Days)

    1. Profit-Taking After Strong Rally

    Saputo shares have risen ~70% over the past year, bringing the stock near its 52-week high (~C$44).

    When a stock rallies rapidly:

    • institutional investors often reduce exposure
    • short-term traders lock in gains

    This creates temporary downward pressure even if fundamentals remain stable.


    2. Mixed Earnings Signals

    Recent quarterly results showed:

    MetricResult
    Adjusted EPSC$0.57 (beat forecast)
    RevenueC$4.9B (missed expectations)

    Revenue missed forecasts by roughly 2% YoY, despite earnings beating estimates.

    Implication:

    • margins improved
    • sales growth was weaker than expected

    Markets typically react cautiously to revenue misses.


    3. Valuation Near Analyst Targets

    Current pricing is close to consensus valuation.

    MetricCAD
    Current price~C$42
    Avg 12-month target~C$44.6
    High target~C$52
    Low target~C$27

    Because the stock is already near fair value, buying momentum tends to fade.


    2. Technical Structure

    Key Support and Resistance

    LevelPrice (CAD)Interpretation
    Major resistance44–45Near 52-week high
    Near resistance43–44Recent rally peak
    Pivot42Current trading area
    Near support41–42Short-term technical support
    Major support39–40Previous breakout zone

    Technical indicators currently show neutral-to-positive momentum, with price still above major moving averages.


    3. Fundamentals Driving the Medium-Term Outlook

    Key earnings drivers for Saputo:

    DriverImpact
    Dairy pricingRevenue volatility
    Input costs (milk, energy)Margin pressure
    Operational efficiency programsMargin expansion
    Global demand for dairyVolume growth

    Recent restructuring and cost-efficiency initiatives have improved margins and EBITDA growth.

    However, revenue growth expectations remain modest.


    4. Scenario Analysis

    3-Month Outlook

    ScenarioPrice RangeDrivers
    Bear39–41weaker dairy demand or TSX risk-off
    Base41–44consolidation after rally
    Bull44–47earnings upgrades or margin expansion

    Probability: Base scenario most likely given price near consensus target.


    12-Month Outlook (Analyst-Based)

    ScenarioPrice RangeDrivers
    Bear36–39margin compression or weaker global dairy demand
    Base43–46moderate earnings growth
    Bull48–52stronger pricing and operating leverage

    Consensus suggests ~5–10% upside from current levels.


    5. Key Risks

    Operational

    • dairy commodity price volatility
    • weak demand in key markets (North America / Europe)

    Financial

    • margin pressure from milk input costs

    Market

    • valuation compression after strong rally

    6. What Would Change the Outlook

    Bullish revision triggers:

    • sustained dairy price increases
    • stronger revenue growth in international markets
    • continued margin expansion

    Bearish triggers:

    • declining dairy demand
    • higher input costs
    • earnings miss on revenue.

    Bottom line:
    Saputo’s recent 10-day decline is primarily technical consolidation after a large 12-month rally and mixed revenue results, not a fundamental deterioration. Current data supports a short-term trading range of roughly C$41–44, with analyst-based 12-month valuation around C$44–46 unless earnings estimates rise materially.

  • RTMA Mar 16: Alimentation Couche-Tard Inc. (ATD.TO)

    Executive Summary

    • Alimentation Couche‑Tard (TSX: ATD) declined modestly over the last ~10 trading days primarily due to profit-taking after hitting a 52-week high and consolidation ahead of earnings.
    • The stock recently traded around C$82–84 after peaking near ~C$85, remaining within its annual range of C$65.95–C$85.59.
    • No material fundamental deterioration occurred; the move appears technical and valuation-driven.
    • Key technical levels: support C$80–82, resistance C$85–87.
    • Analyst consensus implies moderate upside with a 12-month target ~C$89–91 and high estimates around C$100.

    1. Drivers of the Share Price Decline (Past ~10 Days)

    1. Profit-Taking After 52-Week High

    ATD recently reached the upper end of its 52-week range (~C$85).

    When a stock approaches a multi-year high:

    • short-term investors often lock in gains
    • momentum traders reduce exposure

    This results in a pullback without any fundamental catalyst.


    2. Limited Near-Term Valuation Upside

    Analyst targets cluster close to the current price.

    MetricValue
    Current price range~C$82–84
    Avg. 12-month target~C$89–91
    High estimate~C$100
    Low estimate~C$81–82

    Sources: analyst consensus.

    Implication:

    • The stock already trades close to fair value
    • Near-term upside appears single-digit %

    This reduces buying pressure.


    3. Positioning Ahead of Earnings

    The next earnings release is expected March 17, 2026.

    Institutional behavior ahead of earnings typically includes:

    • trimming exposure
    • reducing risk around results

    This can cause short-term price drift lower.


    4. Broader Market Rotation

    In recent weeks the TSX has seen:

    • capital rotating between defensives and cyclicals
    • consumer names consolidating after strong runs

    ATD remains up ~11% YTD, which also increases the probability of short-term consolidation.


    2. Technical Structure

    Support and Resistance

    LevelPrice (CAD)Interpretation
    Major resistance85–87Recent highs / 52-week high zone
    Near resistance84–85Supply zone from recent rally
    Pivot / fair value82–83Current consolidation range
    Near support80–82Strong buying zone
    Major support76–78100-day trend support

    Technical signals remain neutral-to-bullish because the stock trades above major moving averages.


    3. Macro and Sector Drivers

    ATD is sensitive to:

    DriverImpact on Earnings
    Fuel volumesCore traffic driver
    Fuel marginsShort-term profit volatility
    Food & convenience salesHigher margin growth
    M&A activityLong-term expansion

    Recent earnings showed growing same-store sales and strong margins, indicating fundamentals remain stable.


    4. Scenario Outlook

    3-Month Outlook

    ScenarioPrice RangeDrivers
    Bear78–80weaker fuel demand or weak earnings
    Base80–87consolidation near fair value
    Bull87–92strong earnings or margin expansion

    Most probable: range-bound consolidation.


    12-Month Outlook (Analyst Consensus)

    ScenarioPrice RangeDrivers
    Bear75–80margin compression or weak consumer spending
    Base88–95steady earnings growth
    Bull95–100+acquisitions or strong global expansion

    Consensus implies ~8–10% upside from current levels.


    5. Key Risks

    Operational

    • declining fuel volumes
    • lower fuel margins
    • consumer spending slowdown

    Strategic

    • acquisition execution risk
    • integration challenges

    Market

    • valuation compression if retail sector multiples fall

    6. What Would Change the Outlook

    Bullish revision triggers:

    • stronger convenience-store margins
    • successful acquisitions
    • accelerated food-service growth

    Bearish triggers:

    • fuel demand decline
    • weak consumer spending
    • earnings miss.

    Bottom line:
    The recent ~10-day decline in ATD is primarily technical consolidation after a rally and positioning ahead of earnings, not a deterioration in fundamentals. Current market data supports a near-term trading range of roughly C$80–87, with 12-month consensus targets near C$89–95.

  • Consumer Staples Index ($TTCS)

    Executive Summary

    • TTCS (S&P/TSX Capped Consumer Staples Index) ticked up over the past ~10 days mainly due to defensive sector rotation while cyclicals weakened.
    • Broader TSX volatility (materials, tech, financials selling off) pushed investors toward stable earnings sectors such as groceries and essential retail.
    • The sector’s move is macro-driven, not earnings-driven—no major fundamental revisions in staples companies.
    • Index strength is concentrated in few large constituents (Couche-Tard, Loblaw, Dollarama).
    • Net effect: modest upward drift rather than a structural breakout.

    Key Drivers Behind the Recent TTCS Uptick

    1. Defensive Rotation During Market Volatility

    Over the last ~10 days the TSX has been volatile due to geopolitical and macro risks, including Middle East tensions and inflation concerns.

    When markets become unstable:

    • investors typically rotate into defensive sectors
    • consumer staples historically act as low-volatility earnings assets

    This rotation helped lift staples even while several TSX sectors declined.

    Mechanism

    Market ConditionInvestor BehaviourImpact on TTCS
    Rising geopolitical riskReduce cyclical exposureBuy defensive sectors
    TSX drawdownPortfolio hedgingStaples outperform
    Inflation uncertaintyPrefer pricing-power companiesStaples bid up

    2. Relative Outperformance vs Weak Cyclical Sectors

    Recent TSX declines have been concentrated in:

    • financials
    • industrials
    • materials
    • technology

    During these periods the consumer staples sector posted gains (~1.6%) while others fell, reinforcing sector rotation into defensives.

    This relative performance—not absolute growth—is the primary reason the index moved up.


    3. Concentration Effect in the TTCS Index

    The Canadian consumer staples sector is highly concentrated.

    Typical top constituents include:

    • Alimentation Couche-Tard
    • Loblaw
    • Dollarama
    • Metro
    • George Weston

    Canada’s staples sector is dominated by grocery and discount retail companies, which are structurally defensive businesses.

    If 1–2 large constituents move up:

    • the index rises disproportionately.

    4. Structural Sector Momentum (Background Trend)

    The sector has already been strong over the past year.

    Example proxy:

    • XST (Consumer Staples ETF)
      • ~25% 1-year return
      • ~5% YTD gain.

    This momentum provides a baseline bid during market uncertainty.


    What the Move Does NOT Indicate

    The 10-day uptick does not reflect:

    • a change in earnings forecasts
    • sector re-rating
    • new catalysts specific to staples companies

    It is primarily portfolio reallocation during macro volatility.


    Short-Term Interpretation (Technical)

    Current TTCS structure (approximate):

    LevelInterpretation
    ~1330recent resistance area
    ~1300pivot / consolidation
    ~1270support

    The index recently approached its 52-week high near ~1331, showing gradual upward pressure.

    However:

    • upside is limited without earnings upgrades
    • the move is macro-driven defensive demand

    What Would Reverse the Recent Strength

    TTCS typically underperforms when:

    1. Risk appetite returns
    2. cyclical sectors rally
    3. interest rates fall sharply

    In those cases, capital usually rotates out of staples into growth and cyclicals.


    Bottom Line

    The recent 10-day uptick in TTCS is primarily explained by:

    1. Defensive sector rotation amid macro volatility
    2. Relative weakness in cyclicals
    3. Index concentration in stable grocery retailers

    It reflects capital allocation behaviour, not a new growth narrative for the sector.

  • RTMA Mar 16: Linamar Corp (LNR.TO)

    Executive Summary

    • Linamar (LNR.TO) has been volatile over the last ~10 trading days, trading roughly ~C$88–C$95, reflecting consolidation after a strong 12-month rally.
    • The decline primarily reflects profit-taking near analyst target prices and sector cyclicality, not a fundamental earnings shock.
    • Technical range: key support C$88–90, resistance C$95–98.
    • Analyst consensus: average 12-month target ~C$94–96, with high ~C$103 and low ~C$85.
    • Near-term outlook is range-bound unless auto production or industrial segment outlook changes.

    1. What Drove the Share Price Decline (Last ~10 Trading Days)

    Observed price movement

    Date (recent sample)Close (CAD)Daily Change
    Feb 1394.91+5.48%
    Feb 1289.98-1.23%
    Feb 1191.10+1.61%
    Feb 1089.66+1.09%
    Feb 988.69+0.12%

    Source: TSX historical price data.

    Interpretation

    1. Profit-taking after strong rally
      • Stock up ~66–72% over the last 12 months, creating short-term technical overextension.
      • Traders typically trim positions near prior highs (~C$95–98).
    2. Valuation compression near analyst targets
      • The share price is very close to the consensus analyst target (~C$94.83).
      • When price converges with target, momentum investors often exit.
    3. Mixed segment outlook
      • Management expects double-digit growth in the Mobility segment, but Industrial segment sales and earnings are projected to decline, creating earnings uncertainty.
    4. Auto supply chain cyclicality
      • Linamar’s revenue is highly tied to global vehicle production volumes; short-term macro data and auto demand expectations can move the stock even without company-specific news.

    2. Key Technical Levels

    Based on recent trading ranges and prior highs.

    LevelPrice (CAD)Interpretation
    Major Resistance98–100Prior 52-week high (~98.65)
    Near-term Resistance94–95Area where rallies stall
    Pivot / Fair Value91–92Average recent trading zone
    Near Support88–90Recent bounce zone
    Major Support83–85Lowest analyst target

    52-week range: C$43.84 – C$98.65.


    3. Analyst Forecasts (Forward Outlook)

    Consensus Targets

    MetricCAD
    Average target94.83–95.54
    High estimate103
    Low estimate85–86
    Analyst ratingBuy / Moderate Buy

    Sources: analyst consensus data.


    4. Scenario Analysis

    3-Month Outlook (short-term)

    ScenarioPrice RangeDrivers
    Bear85–88Global auto production slowdown, industrial segment weakness
    Base88–95Range-bound consolidation near fair value
    Bull95–100Strong auto build rates or margin expansion

    Probability bias: Base scenario most likely because price already reflects current analyst targets.


    12-Month Outlook

    ScenarioPrice RangeKey Drivers
    Bear80–85Auto cycle downturn, industrial segment deterioration
    Base95–103Earnings growth in mobility segment + stable margins
    Bull105–110EV component growth, higher global vehicle production

    Consensus aligns closest to ~95–100 range.


    5. Valuation Context

    MetricValue
    Market cap~C$5.7B
    P/E (TTM)~22.5
    Dividend yield~1.2%
    Beta~1.30

    Interpretation:

    • Valuation slightly above auto-components industry average on P/E terms.
    • Growth expectations from mobility segment justify premium, but limit upside if earnings slow.

    6. Key Risks to the Outlook

    Macro

    • Global auto production slowdown
    • North American vehicle demand decline
    • Interest-rate sensitive consumer spending

    Company-specific

    • Industrial segment revenue contraction
    • Execution risk in EV component transition
    • Margin pressure from OEM pricing negotiations

    Market

    • Stock already near analyst target → limited upside unless estimates rise.

    7. What Would Disprove the Base Case

    The neutral outlook would change if:

    1. Auto production forecasts materially rise (North America or Europe).
    2. Linamar announces major EV supply contracts.
    3. Industrial segment declines faster than expected.

    These would respectively shift the stock toward bull (>100) or bear (<85) ranges.


    Bottom line:
    The recent 10-day pullback in LNR is mostly technical consolidation after a strong rally and proximity to analyst price targets, not a fundamental deterioration. Current data supports a short-term trading band ~C$88–95, with 12-month consensus upside limited to roughly ~C$95–103 unless earnings estimates are revised upward.

  • RTMA Mar 16: Dollarama Inc (DOL.TO)

    1) Why DOL.TO declined over the past ~10 days

    1️⃣ Short-term profit-taking after a strong rally

    Dollarama has been one of the best-performing Canadian retail stocks, recently trading close to its 52-week highs near C$210. After such strong gains, investors often lock in profits, which leads to short-term pullbacks.

    This type of movement is typical when a stock approaches new highs and becomes temporarily overbought.


    2️⃣ Technical momentum weakening

    Technical indicators recently shifted from strong bullish signals toward neutral:

    • Some moving-average indicators now signal short-term “sell” or weakening momentum.
    • However, longer-term indicators remain mostly bullish.

    This suggests the recent decline is likely a consolidation phase rather than a trend reversal.


    3️⃣ Valuation concerns

    Dollarama trades at a premium valuation compared with most Canadian retailers because of its strong growth and margins.

    When a stock becomes expensive relative to peers, investors may pause buying or trim positions until:

    • earnings catch up
    • the price consolidates

    4️⃣ Sector rotation

    Recently, investors have rotated capital toward technology and AI-related stocks, causing some defensive retail names like Dollarama to temporarily underperform.


    2) Key support and resistance levels

    Recent pivot levels suggest the following technical zones:

    Support levels

    • C$187.7 – immediate support
    • C$186.6 – secondary support
    • C$185.2 – strong near-term support

    If C$185 breaks, the next technical zone could appear around C$178–180.


    Resistance levels

    • C$190.2 – first resistance
    • C$191.6 – intermediate resistance
    • C$192.7 – strong resistance

    A break above ~C$193–195 could reopen the path toward C$200–210.


    3) 3-Month Outlook

    Based on current momentum and valuation:

    ScenarioPrice range
    Bearish caseC$175 – C$185
    Base caseC$185 – C$200
    Bullish caseC$200 – C$210

    Short-term movement will largely depend on:

    • consumer spending trends
    • next earnings release
    • overall TSX retail sentiment

    4) 12-Month Analyst Forecast

    Analyst sentiment remains bullish overall.

    • Consensus rating: Moderate Buy
    • Average price target: about C$211–C$216
    • High target: about C$235
    • Low target: about C$195

    This implies roughly 9–12% upside from current levels.


    5) Key drivers for the next 12 months

    Positive catalysts

    • continued same-store sales growth
    • expansion of Dollarcity and international stores
    • strong demand for discount retail during economic pressure

    Dollarama has recently benefited from consumers shifting toward cheaper goods amid inflation, boosting traffic and sales.

    Risks

    • high valuation
    • slower consumer spending
    • integration risk from the Australian Reject Shop acquisition

    Bottom line

    • The recent drop is mainly technical consolidation after a strong rally.
    • Long-term outlook remains positive with moderate upside according to analysts.

    Summary

    Time horizonExpected range
    3 monthsC$185 – C$205
    12 monthsC$195 – C$235
    Consensus target~C$211–216

  • RTMA Mar 16: Canadian Tire Corp (CTC-A.TO)

    1) Share price chart

    (Recent market trend)


    2) Why CTC.TO declined over the last ~10 days

    1️⃣ Short-term technical downtrend

    The stock has fallen in about 6 of the last 10 sessions, indicating a short-term negative momentum trend.

    Technical analysis suggests the stock is currently inside a declining short-term price channel, which often leads to temporary price weakness.


    2️⃣ Profit-taking after earlier gains

    Canadian Tire had performed relatively well earlier in the cycle, benefiting from:

    • improved consumer spending
    • loyalty program growth
    • retail transformation initiatives

    Investors often take profits after such rallies, creating short-term corrections.


    3️⃣ Concerns about consumer spending

    Canadian Tire is a consumer discretionary retailer, meaning sales depend on household spending.

    Investors remain cautious because:

    • higher borrowing costs affect consumer budgets
    • retail sales growth has slowed
    • earnings growth expectations are modest

    This cautious outlook has weighed on the stock recently.


    3) Key Support and Resistance Levels

    (Based on technical trend zones and moving averages)

    Support levels

    • C$200–205 → Immediate support
    • C$190–195 → Strong support zone
    • C$170–175 → Major longer-term support

    If C$200 breaks, the stock could drift toward C$190.


    Resistance levels

    • C$215–220 → Near-term resistance
    • C$230 → Strong resistance
    • C$245–250 → Major resistance zone

    A move above ~C$220 would signal a potential bullish reversal.


    4) 3-Month Outlook

    Quantitative forecast models suggest:

    • Expected decline of ~13% over the next 3 months if the current downtrend persists.
    • Probable trading range:

    C$169 – C$194 (90% probability range).

    Short-term scenarios

    ScenarioPrice range
    BearishC$170 – C$185
    Base caseC$185 – C$205
    BullishC$210 – C$225

    5) 12-Month Analyst Outlook

    Analyst sentiment is neutral to slightly cautious.

    • Consensus rating: Hold / Reduce
    • Some analyst targets around ~C$140–C$175 depending on valuation assumptions.

    12-month forecast range

    ScenarioPrice target
    Bearish~C$170
    Base case~C$200
    Bullish~C$230

    Expected upside is limited because earnings growth forecasts are relatively slow (about ~4% annually).


    6) Key factors that will drive CTC stock

    Positive catalysts

    • stronger Canadian consumer spending
    • loyalty program and digital retail growth
    • dividend yield (~4–5%)

    Risks

    • weak discretionary spending
    • margin pressure from promotions
    • retail competition (Walmart, Amazon, Costco)

    Simple takeaway

    • Recent decline is mostly technical and sentiment-driven, not due to a major negative event.
    • Short-term trend: slightly bearish / consolidation
    • Long-term outlook: stable dividend stock with moderate growth