SUMMARY:
- The U.S. did not renew/extend the USMCA trade deal at the July 1 review point, but that does not immediately end the agreement. If no new agreement is reached, the deal can continue until 2036, when it expires. [2]
- Trade rules remain mostly unchanged for now: products that were tariff-free on June 30 continued trading tariff-free on July 2. [1]
- The key uncertainty is political and sector-specific. U.S. tariffs on automobiles remain in place, keeping pressure on Canada’s auto supply chain and cross-border manufacturers. [1]
- For Canada and Mexico, the base case is continued negotiation rather than an immediate trade breakdown. The risk is a prolonged period of uncertainty for exporters, investors, and companies with North American supply chains. [6]
🌐 Sources
- theglobeandmail.com – USMCA wasn’t renewed. What’s next for the North …
- theglobeandmail.com – Trump administration declines to renew USMCA trade deal
- x.com – USMCA wasn’t renewed. What’s next for the North …
- theglobeandmail.com – Canada has nothing to fear from the USMCA review
- facebook.com – The U.S. says it won’t renew the trade deal with Mexico and …
- theglobeandmail.com – No extension to USMCA expected as key date arrives
DETAILS:
North American trade entered a new phase on July 1, with U.S. President Donald Trump declining to renew the United States-Mexico-Canada Agreement for another 16 years.
As part of a mandatory six-year review of the continental trade pact, the three countries had to decide on July 1 whether to extend the USMCA until 2042, or move into a period of annual reviews until 2036, after which the treaty will expire if no extension agreement is reached.
Ottawa and Mexico City asked for the 16-year extension. Washington refused. So what’s the state-of-play and what might happen next?
Does anything change right away?
No. The treaty, which replaced the North American free-trade agreement (NAFTA) in 2020 and sets out the rules for continental trade, remains in force. Likewise, the U.S. tariff carve-out for Canadian and Mexican goods that comply with USMCA rules of origin remains in place.
The tariff landscape stays the same, at least for now. Products that traded tariff-free on June 30 will continue to trade tariff-free on July 2. Meanwhile, U.S. tariffs remain in place on automobiles, industrial metals and wood products, as well as Canadian and Mexican goods that don’t meet USMCA rules of origin.
Is the U.S. withdrawing from the agreement?
No. We’re on the no extension-no withdrawal path.
Any of the three parties can withdraw from the agreement with six months’ notice; that’s always been the case. Mr. Trump may yet threaten to pull out of the agreement if he wants to turn the screws on Ottawa or Mexico City. But as it stands, he has not moved to kill the agreement.
Former top Republican sees ‘Fortress North America’ concept as a winner in USMCA trade talks
It remains unclear whether the President has the power to withdraw from the USMCA unilaterally without approval from Congress. U.S. lawyers have a range of opinions on this issue, and any attempt would likely end up being litigated in the U.S. Supreme Court.
What happens next?
Without a 16-year extension, the agreement moves into a period of annual reviews that will last for a decade. Technically, this is an exit ramp. If no extension agreement is reached by 2036, the USMCA will expire. However, there will be plenty of opportunities to reach an agreement before that final deadline.
In practice, the new phase of annual reviews will feel like a continuation of the status quo, at least in the near term. Trade negotiations that have gotten underway in recent months are expected to continue over the summer.
The three sides can strike a 16-year extension agreement – or some other sort of deal – at any time. If this hasn’t happened by next summer, the three parties will hold another trilateral meeting on July 1, 2027 – and so forth, each year until 2036.
What’s happening with trade negotiations?
So far, the Trump administration has chosen to deal with Canada and Mexico separately, starting with Mexico.
Washington and Mexico City have already held two rounds of bilateral talks about the future of the USMCA: one discussing rules of origin for automobiles, steel and aluminum, and economic security issues; the other focused on agriculture, labour and the environment. The two countries have scheduled a third negotiating round for the week of July 20.
The U.S. team is led by U.S. Trade Representative Jamieson Greer and his No. 2 Jeffrey Goettman, while the Mexican team is led by Economy Secretary Marcelo Ebrard.
Washington and Ottawa have not yet begun formal negotiations about potential changes to the USMCA, although Canada’s chief negotiator Janice Charette and Intergovernmental Affairs Minister Dominic LeBlanc have met Mr. Greer and his team several times in recent months to discuss non-tariff trade barriers.
It’s unclear at this point if and when the separate bilateral trade talks will merge.
Are we heading toward separate bilateral deals?
Quite possibly. Mr. Greer has said he wants to maintain the “load-bearing pillars” of the trilateral deal while layering separate bilateral “protocols” with Canada and Mexico on top. Mr. LeBlanc said at an event in June that bilateral deals were now his baseline assumption.
“I would expect that we’ll have bilateral arrangements between Canada and the United States, between the United States and Mexico, sort of adjacent to the trilateral framework,” Mr. LeBlanc said. “If those agreements resolve issues that all three countries are trying to resolve, I’m hopeful that we might at that point have the extension. But if not, we’ll continue to do what’s necessary to preserve the trilateral framework.”
It’s not yet clear what form these bilateral arrangements would take. They could be side letters to the USMCA, or chapters added to the agreement addressing bilateral issues. They could also be separate arrangements that look more like the “agreements on reciprocal trade” Washington struck with other trade partners, including the European Union, Japan and Britain, last year.
Mr. Trump has a clear preference for negotiating country-to-country, rather than as part of a group. And it may prove easier, from a legal perspective, to make changes to trade rules in a pair of separate side-agreements using executive powers. Substantial changes to the USMCA itself would likely require congressional approval – although lawyers debate this point.
What does non-renewal mean for the Canadian economy and Canadian businesses?
From one perspective, it’s status quo. Most Canadian exports will continue to enter the U.S. tariff-free, while certain sectors – namely steel, aluminum, copper, metal derivative products, automobiles, lumber and furniture – will continue to face hefty tariffs of between 25 per cent and 50 per cent.
On balance, the Bank of Canada estimated in April that the average effective U.S. tariff rate on Canadian goods was 5.1 per cent.
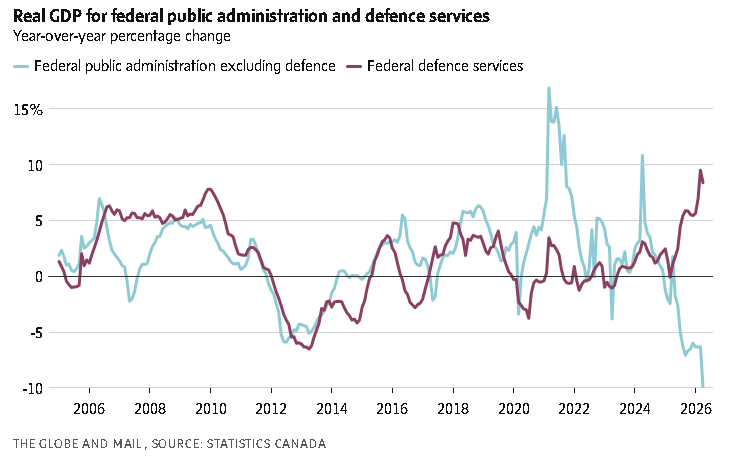
At the same time, non-renewal will extend the period of uncertainty that has weighed on business investment in Canada, leading to five consecutive quarters of falling investment.
“There’s uncertainty about what is going to play out. There is also uncertainty about exactly how the Canadian economy adjusts,” Bank of Canada governor Tiff Macklem said in a press conference last week, when asked about the USMCA review.
“There is no question the Canadian economy is going through an important restructuring. While certainly we hope that trade relations with the United States improve, the severe tariffs on a number of sectors, hopefully those can be scaled back, and we can get more certainty. … If that were to happen, I think you could see some more investment. But there are other outcomes as well.”
How did we get here?
When the three countries negotiated the USMCA as a replacement for NAFTA during the first Trump presidency, the U.S. demanded the addition of a 16-year “sunset clause” with a six-year review. The Trump administration felt that NAFTA had become stale over time and wanted to build in checkpoints and an exit ramp.
U.S. officials also wanted to maintain leverage over Canada and Mexico, giving it the ability to extract concessions at a future date. At the time, Mr. Trump’s son-in-law Jared Kushner, one of the architects of the deal, described the strategy in real estate terms.
“Why lock in today’s market rates if you will be able to charge more in the future?” Mr. Kushner wrote in an op-ed for CNBC in 2020. “The USMCA approach is akin to the United States granting Mexico and Canada a 16-year lease for market access, with a fair market value readjustment clause that is triggered every six years.”
What does the U.S. want?
The Trump administration sees the review of the USMCA as an opportunity to do at least two things: Push Canada and Mexico to change various regulatory, tax and trade policies that Washington believes disadvantage American companies; and to tighten North American supply chains to reduce the amount of Chinese products entering the continental market.
In the first bucket, the U.S. has a long list of grievances with both countries that it outlines every year in its National Trade Estimate Report of Foreign Trade Barriers. For Canada, this includes things like online streaming regulations, provincial bans on U.S. liquor and how dairy quotas are allocated. For Mexico, it includes restrictions on energy investments, intellectual property rules and agriculture.
In the second bucket, the U.S. is looking to tighten rules of origin for automobiles and other “strategic” sectors, which could include industries like semiconductors, pharmaceuticals and aircraft. In the bilateral talks with Mexico, U.S. officials suggested increasing the North American content requirement for cars to 82 per cent from 75 per cent, and adding a requirement that half the vehicle must be made of U.S. parts.
The Trump administration also wants more co-ordination between the three countries on external tariffs, particularly on China. And it has suggested it wants both countries to pay more attention to the sources of capital, with the goal of reducing Chinese investment in North America under the banner of “economic security.”
Canada and Mexico have signalled an openness to this “Fortress North America” approach, although Prime Minister Mark Carney’s decision to break with Washington earlier this year over tariffs on Chinese electric vehicles, and his attempt to court Chinese investment in the Canadian auto industry, could be a sticking point.
What do Canada and Mexico want?
Relief from U.S. sectoral tariffs; the preservation of the tariff carve-out for goods that comply with USMCA rules of origin; and some sense of stability in U.S. tariff policy.
Mexican and Canadian officials have said they don’t expect to return to a zero-tariff world that existed under NAFTA. The goal, according to Ms. Charette, is the “lowest possible tariffs on the narrowest basket of goods with the most market access for Canadian products.”
The priority for Ottawa is getting Mr. Trump to lower the Section 232 sectoral tariffs on steel, aluminum, automobiles and wood products. Before trade talks broke down in the fall, Ottawa and Washington were working on some sort of steel and aluminum deal that involved a combination of lower tariffs and quotas.
Canadian officials have said they’re ready to resume discussions along these lines whenever the Americans are.
Is there any chance a deal could be reached soon?
It depends on who you ask. Some trade watchers believe that the President has an incentive to reach an agreement with Canada and Mexico before the U.S. midterm elections on Nov. 3, so he can present it as a win and help reduce cost-of-living pressures that stem from the tariffs.
Others think trade talks could drag on into the new year, with the possibility that no deal is finalized before the end of Mr. Trump’s term in early 2029. Ultimately, Mr. Trump is in control of the timeline, not Ottawa or Mexico City.
“We prefer the status quo over a bad deal,” Mr. Carney said ahead of the review. But he added that arriving at an updated agreement is a priority. “We are ready to negotiate improvements to this agreement.”
What’s next?
The next date to watch is July 20, when the U.S. and Mexico begin their third round of trade talks.
The other key date is July 24. That’s when the U.S. is expected to introduce its new global tariff regime to replace the tariffs that were struck down by the U.S. Supreme Court in February.
The new tariffs will be imposed using Section 301 of the U.S. Trade Act of 1974, which allows the President to levy tariffs in response to alleged discriminatory foreign trade practices.
The U.S. has already said it will impose tariffs of between 10 per cent and 12.5 per cent on 60 countries, including Canada, for allegedly not doing enough to address forced labour in their supply chains. So far, the Trump administration has said it will maintain the carve-out for USMCA-compliant goods from Canada and Mexico.