Author: Consultant

  • Mar 20/26: Canadian Stocks Plummet As Gulf War Shows No Sign Of De-escalation

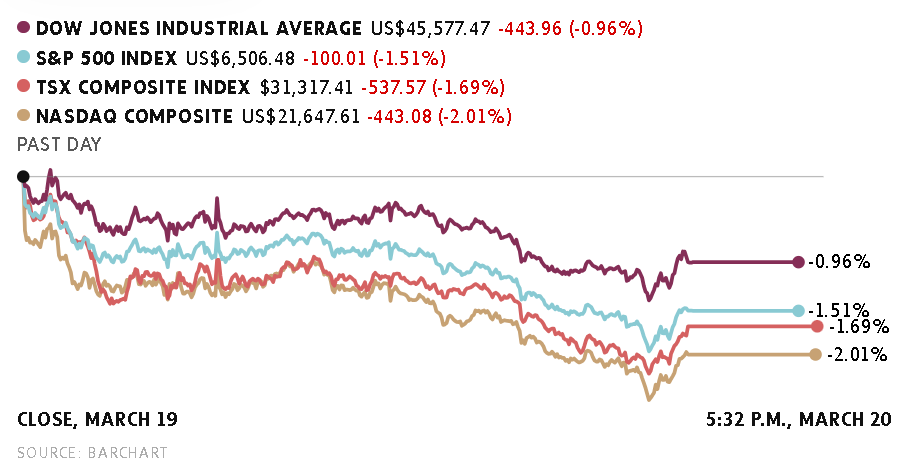
    Extending the nosedive seen over the two previous sessions, Canadian stocks plunged on Friday as inflationary concerns due to the intensifying gulf war pressured investors away from risky assets.

    After opening below yesterday’s close, today the benchmark S&P/TSX Composite Index traded firmly negative before settling at 31,317.23, up by 537.75 points (or 1.69%).

    Of the 11 sectors, only Consumer Staples posted gains today.

    The U.S.-Israel versus Iran war entered day number twenty-one.

    Today, Kuwait’s largest oil refinery, Mina al-Ahmadi, which processes around 730,000 barrels of oil per day, was struck by Iran, leading to the shutdown of several of its units.

    Following Israel’s massive attacks on Iran’s South Pars gas field, Iran conducted strikes on Qatar’s largest LNG plant, Ras Laffan. The facility suffered extensive damage, with the resumption of operations estimated to begin only after a year.

    Iran warned that it will show “zero restraint” if its facilities are attacked again.

    With an end to the conflict, becoming unpredictable, the spike in crude oil prices and the resultant inflation concerns, along with vanishing expectations of any rate cut in the near-term, have forced investors to avoid making “big” investments.

    The Strait of Hormuz, a narrow waterway off Iran’s coastal region remains blocked for vessels carrying oil and energy from Arab nations.

    The U.S. Federal Reserve held interest rates at the current 3.50% to 3.75% range on Wednesday.

    Market participants have canceled their bets on lowering of interest rates by the Fed, with many of them anticipating a rate hike this year.

    The CME Group’s FedWatch Tool was last seen indicating that traders were betting on a 12.40% chance of a “quarter-point rate hike” at the April meeting.

    Other central banks globally have followed suit, expressing concerns about the impact of skyrocketing crude oil prices on national economies and the inflationary effects.

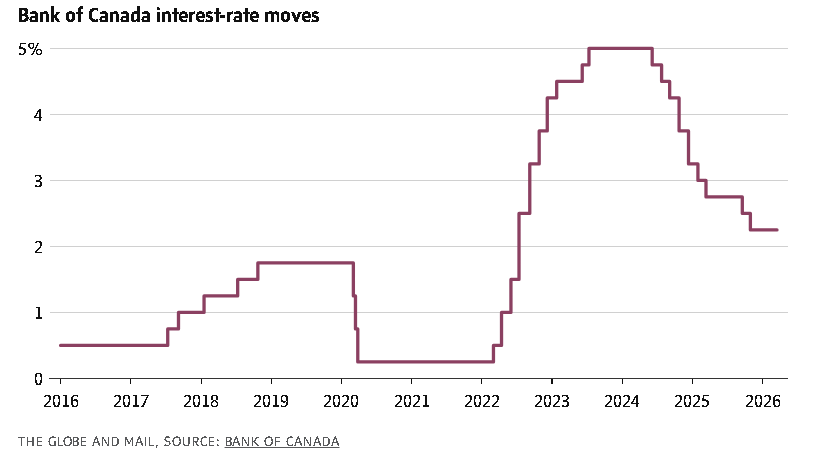
    On Wednesday, the Bank of Canada elected to hold interest rates at the current 2.25% level.

    Data released by Statistics Canada today revealed that Canadian producer prices rose by 0.4% month-over-month in February, below market forecasts of a 1.1% increase. Producer Prices surged 5.4% in January compared to the same month in the previous year.

    A preliminary estimate revealed that retail sales in Canada increased by 0.90% from February.

    With rate-cut expectations receding from the radar, the attention of traders is now focused on any breakthrough in the Canada-United States-Mexico agreement.

    The only sector that gained in today’s trading was Consumer Staples (0.17%).

    Among the individual stocks, Maple Leaf Foods (2.37%), Saputo Inc (1.36%), Metro Inc (0.80%), and Weston George (0.45%) were the prominent gainers.

    Major sectors that lost in today’s trading were Utilities (2.02%), IT (2.62%), Healthcare (2.94%), and Materials (3.13%).

    Among the individual stocks, Lithium Americas Corp (7.59%), Vizsla Silver Corp (6.85%), B2Gold Corp (6.75%), Perpetua Resources Corp (5.77%), and Curaleaf Holdings Inc (4.75%) were the notable losers.

    Orla Mining Ltd (4.50%) and Secure Waste Infrastructure Corp (3.65%) were among the prime market-moving stocks today.

  • Mar 20/26: Major indexes end sharply lower, bond yields surge as traders increase bets for BoC and Fed rate hikes

    Markets update

    • Stocks ended sharply lower, as the U.S.-Israeli war against Iran entered its fourth week, deepening worries about inflation ⁠and the ​potential for higher interest rates. The U.S. military was deploying a large amphibious assault ship with thousands of additional Marines and sailors to the Middle East, while Iran’s new supreme leader hailed ​Iran’s “unity” and “resistance.”
    • The S&P 500 declined 1.51% to end the session at 6,506.48 points, its lowest since September. The Nasdaq slumped ​2.01% to 21,647.61 points, leaving it down almost 10% from its record high close on October 29. The Dow Jones Industrial Average declined 0.96% to 45,577.47 points.
    • The S&P/TSX composite index was down 1.69%, at 31,317.23. All major ​sectors on the TSX were in negative ‌territory, with materials leading losses, down 3.1%. Energy stocks fell 0.6%. The TSX fell 3.8% this week and closed at its lowest level since December, extending its total decline since ​the Iran war began to nearly 9%.
    • Short-term bond yields were sharply higher in both the U.S. and Canada. Money markets are now fully pricing in a quarter-point interest rate hike by the Bank of Canada by this July’s policy meeting. Almost three quarter-point rate hikes are priced in by the end of this year. Canada’s 2-year bond yield, sensitive to central bank policy moves, was up 23 basis points by late afternoon to its highest level in more than a year. For the Fed, interest-rate futures were pricing ⁠around a ​25% chance of a rate hike by December.
    • Oil prices jumped ‌to their highest in nearly four years, as Iraq declared force majeure on all oilfields developed by foreign oil firms. Brent futures for May settled up $3.54, or ⁠3.26%, to $112.19 ​a barrel, the highest since July 2022. U.S. West Texas Intermediate crude futures for April, which expired on Friday, settled up $2.18, or 2.27%, at $98.32. 
    • Gold prices fell nearly 2 per cent as the U.S. dollar strengthened.
  • Forecast Gold prices for next 3 months (April – June)

    Gold prices have been highly elevated in early 2026, with recent spot prices fluctuating around $4,800–$5,000 per ounce (based on mid-March 2026 data, showing some volatility and pullbacks from earlier highs near $5,200+).

    Forecasts for the next 3 months (roughly April through June 2026, or Q2) are mixed but lean bullish overall, driven by factors like central bank buying, investor diversification into gold, geopolitical uncertainties, potential lower interest rates, and a weaker US dollar in some scenarios. However, short-term corrections are possible due to recent volatility, economic data (e.g., inflation readings, Fed policy), or risk-off events.

    Key Analyst Forecasts and Outlooks

    Major institutions and models project upward momentum through 2026, with many seeing potential gains in the coming months:

    • J.P. Morgan remains strongly bullish, expecting prices to push toward higher levels in 2026 overall (with year-end targets around $5,000–$6,300/oz in various updates). They highlight sustained demand from central banks and investors as key drivers.
    • UBS targets up to $6,200/oz for periods including March, June, and September 2026, suggesting potential for 20%+ gains from certain levels, though with some consolidation expected later in the year.
    • Goldman Sachs has raised targets, with year-end 2026 forecasts around $5,400/oz, implying room for upside in the near term from current prices.
    • Macquarie (earlier 2026 updates) projected Q1 averages around $4,590/oz and Q2 around $4,300/oz, but these may have been revised upward amid ongoing rallies.
    • Algorithmic/model-based forecasts (e.g., from CoinCodex) show monthly ranges for April–June 2026 with potential highs above $5,000 (e.g., up to $5,185 in some monthly upside scenarios), though with volatility and possible dips.
    • World Gold Council scenarios suggest moderate gains (5–15%) or stronger surges (15–30%) in 2026 depending on economic slowdowns or risk events, which could play out in Q2.

    Consensus across sources points to gold trading in a broad range of roughly $4,300–$6,200/oz through mid-2026, with many expecting net upside from current levels (~$4,800–$5,000) due to structural demand trends.

    Short-Term Considerations (Next 3 Months)

    • Bullish case: Continued central bank purchases, persistent inflation/geopolitical risks, or Fed signals of easier policy could drive prices toward $5,200–$5,800+.
    • Bearish risks: Stronger-than-expected economic data, higher yields, or reduced safe-haven demand could lead to pullbacks toward $4,500 or lower support levels.
    • Prices are not linear—expect volatility, as seen in recent swings.

    Gold forecasts are inherently uncertain and influenced by unpredictable events (e.g., Fed decisions, global tensions). This is not financial advice; always do your own research or consult a professional advisor before making investment decisions. For real-time prices, check reliable sources like Kitco or Bloomberg.

  • March 19: Why is gold cratering? Wall Street veteran Ed Yardeni has some thoughts

    Gold is down about 6% at midday and is now down more than US$700 an ounce since March 2, a couple days after the start of the Middle East conflict.

    There are mounting concerns the war will continue for some time to come. So why isn’t gold – known for being one of the market’s biggest safe haven investments – doing so poorly amid the surge in geopolitical tensions and market uncertainty?

    Recent strength in the U.S. dollar – which tends to move inversely to gold – can explain some of gold’s lack of glitter of late. But that unlikely explains all of it, given the greenback’s moves against major currencies have been relatively rangebound by comparison.

    Veteran Wall Street analyst Ed Yardeni offered up some other suggestions on why gold has lost its popularity in a note to clients today.

    “The always-reliable quick answer is: profit-taking following a meteoric rise. Perhaps investors in the Middle East are selling gold to buy the US dollar, which has strengthened during the war, even though both are considered safe havens. Rising bond yields might also explain gold’s recent meltdown. The probability of further Fed rate cuts is falling as inflation heats up,” he said.

    “Technically speaking, gold’s price dropped below a short-term uptrend line this week. The next uptrend support line could be tested closer to $4000. Another technical explanation is that the gold price rose too far, too fast since early last year, jumping above its ascending channel this year.”

    “We are still targeting gold at $6,000 by the end of this year and $10,000 by the end of 2029. However, we are considering lowering our year-end target back to $5,000 if gold continues to defy our expectations that it should be rising on unsettling geopolitical developments, rising inflation, and mounting US government debt.”

    “From a sentiment perspective, the recent drop in GLD’s stock price on high volume suggests panic selling. From a contrarian perspective, that could soon make a bottom in the recent selloff.”GLD-A -5.42%decrease, the SPDR Gold Shares ETF, is the world’s largest physically backed gold exchange-traded fund

  • BoC holds benchmark rate at 2.25% amid oil price shock

    The Bank of Canada held its benchmark interest rate steady on Wednesday but said it’s prepared to adjust monetary policy if needed amid a global oil price shock that risks reigniting inflation.

    As widely expected, the central bank’s governing council kept the policy rate at 2.25 per cent for the third consecutive time.

    The rate decision was made against the backdrop of a sharp rise in energy prices caused by the war between the United States, Israel and Iran, which has largely closed the Strait of Hormuz through which around a fifth of global oil supplies typically travel.

  • March 18: U.S. Federal Reserve, Bank of Canada keep key interest rates unchanged amid oil-driven inflation risks

    The U.S. Federal Reserve left short-term interest rates unchanged for the second straight meeting. In a statement, the central bank said that the “implications of developments in the Middle East for the U.S. economy are uncertain.”

    The Bank of Canada held its benchmark interest rate at 2.25 per cent for the third consecutive time. However, Governor Tiff Macklem said the central bank is “ready to respond” if needed amid a global oil price shock caused by the war in the Middle East that risks reigniting inflation.

    Key moments:

  • NTR.TO Chart

    NTR.TO (solid blue, left axis) shows the sharp run-up from ~CA$65 to over $106, while potash MOP prices (dashed orange, right axis) climbed more modestly from ~$320 to ~$355/MT over the same period.

  • Canada’s inflation rate eases to 1.8% in February but rising oil prices likely to change outlook

    Canada’s annual inflation rate fell to 1.8 per cent in February, after prices in the same period a year ago had risen sharply when the government’s sales-tax relief ended, Statistics Canada said on Monday. Excluding the effect of indirect taxes, the Consumer Price Index rose 1.9 per cent year-over-year in February, it said.

    The inflation data for March will be the final month affected by the base-year effect of the sales tax break. But rising crude oil prices as a result of the Iran war are likely to change inflation expectations.

    Economists polled by Reuters had expected inflation to fall to 1.9 per cent year-over-year in February from 2.3 per cent in January, and 0.7 per cent month-over-month compared with no change in the prior month.

    https://charts.theglobeandmail.com/0CIph/33

    On a monthly basis consumer prices rose by 0.5 per cent in February, Statscan said. The Bank of Canada has held its key policy rate at 2.25 per cent since October, as inflation stabilized around its 2-per-cent target within a 1- to 3-per-cent control range. The BoC will give some indication of inflationary pressures at its policy decision on Wednesday.

    “The tame (CPI) report will be welcomed by policymakers ahead of the energy price shock, as it shows that labor market slack is keeping a lid on core prices, with the issue for the BoC being how long the oil price shock lasts for and its magnitude,” Katherine Judge, senior economist at CIBC Capital Markets, wrote in a note. Despite the base year effect, food prices in February rose by 5.4 per cent on an annual basis as food purchased at restaurants increased by 7.8 per cent last month.

    Bank of Canada expected to hold rates amid oil-driven inflation risk

    Food prices have remained a major pressure point for Canadian households, as grocery prices have risen faster than overall inflation due to U.S. President Donald Trump’s tariffs, bad weather conditions and supply chain issues.

    Grocery prices rose 4.1 per cent in February after a 4.8-per-cent rise observed in January, and the statistics agency said they have risen by 30 per cent in the last five years. Gasoline prices decelerated by 14.2 per cent in February due to the continued impact of the removal of a carbon tax on the fuel, which reduced the year-over-year price. This impact will stay until April, Statscan said.

    Shelter costs – the largest component of the CPI basket with a weight of roughly 29 per cent – rose at a slower pace of 1.5 per cent in February as mortgage costs continued to ease. Rent costs rose 3.9 per cent on an annual basis in February.

    Economists and the Bank of Canada closely watch core measures of inflation to gauge underlying price pressures.

    The CPI-median, the centermost component of the CPI basket, was 2.3 per cent, while CPI-trim, which excludes the most extreme price changes, was also at 2.3 per cent.

    The Canadian dollar firmed and was trading up 0.28 per cent to $1.3679 against the U.S. dollar, or 73.10 U.S. cents. Yields on two-year government bonds fell 6.5 basis points to 2.731 per cent.

  • Forecast Week March 16 – March 20

    Executive Summary

    • The S&P/TSX Composite enters the week of 16 March near ~32,540, about 5.8% below its early-March record high, after a risk-off week driven by geopolitics and weak Canadian data.
    • Short-term direction will be dominated by Middle East war developments, oil price volatility, and global central-bank signals.
    • Canadian macro data has turned weaker (job losses, widening trade deficit), which may weigh on financials and cyclicals.
    • Commodities remain the main support: energy and metals historically drive TSX performance, with energy already up strongly year-to-date.
    • Base case for the week: volatile consolidation between ~32,200–33,100, with direction tied mainly to oil and geopolitical news.

    Current TSX Positioning

    MetricValue
    Latest close~32,542
    Weekly change−1.6%
    Distance from record high−5.8%
    1-year performance+32%

    Interpretation:
    The TSX is in a corrective phase after record highs, not a bear trend.


    Key Macro Drivers for the Week

    1. Middle East Conflict and Oil Prices

    • Rising geopolitical tension around Iran and the Strait of Hormuz has already pressured global markets.
    • Oil prices have risen sharply during the conflict, with Canada preparing to increase supply as part of global releases.

    Impact on TSX

    SectorEffect
    Energy (16% of TSX)bullish if oil rises
    Industrials / airlinesnegative from fuel costs
    Global equitiesrisk-off sentiment

    Canada’s market tends to outperform when oil rises due to its heavy energy weighting.


    2. Weak Canadian Economic Data

    Recent data has deteriorated:

    IndicatorLatest
    Employment−83,900 jobs
    Unemployment6.7%
    Trade balanceC$3.65B deficit

    Implications:

    • negative for banks and cyclicals
    • increases probability of policy easing later in 2026

    3. Central Bank Policy Signals

    Major central banks are meeting or signaling policy outlooks.

    Key market questions:

    • Will energy-driven inflation delay rate cuts?
    • Will central banks prioritize growth over inflation?

    Markets are closely watching policy responses to the geopolitical shock.


    4. Commodity Price Movements

    The TSX is heavily driven by commodities.

    CommodityImpact
    Oilpositive for TSX
    Goldpositive for materials
    Copper / industrial metalssignals global growth

    Recent pullbacks in metals contributed to the latest decline in the index.


    Sector Sensitivity This Week

    SectorWeight (approx.)Directional Bias
    Financials~30%sensitive to economic data
    Energy~16%tied to oil price volatility
    Materials~12%tied to gold / metal prices
    Technology~7%tied to US tech sentiment

    This means energy and financials will largely determine index direction.


    Technical Structure (Index)

    LevelTSX LevelInterpretation
    Major resistance~33,200–33,400previous highs
    Near resistance~33,000rebound ceiling
    Pivot~32,500current trading zone
    Near support~32,200short-term support
    Major support~31,600–31,800February base

    A break below 32,200 could trigger further technical selling.


    Scenario Forecast for the Week

    Bull Case

    Range: 32,900 – 33,400

    Drivers:

    • oil > $100
    • easing geopolitical fears
    • strong US economic data

    Likely sectors leading:

    • energy
    • materials
    • banks

    Base Case

    Range: 32,200 – 33,100

    Drivers:

    • continued geopolitical uncertainty
    • mixed economic data
    • commodity volatility

    Most probable outcome: sideways with large intraday swings.


    Bear Case

    Range: 31,600 – 32,200

    Drivers:

    • escalation in Middle East conflict
    • falling metals prices
    • weaker global equity markets

    12-Month Structural Outlook (Context)

    Consensus expectations remain positive:

    DriverForecast
    TSX earnings growth~16%
    Primary driversenergy, materials, banks

    However, macro risks remain:

    • geopolitical tensions
    • global growth slowdown
    • trade tensions.

    Key Data Releases to Watch This Week

    RegionData
    Chinaindustrial production, retail sales
    USindustrial production
    Europeinflation updates
    Globalcentral bank policy commentary

    These will influence commodity demand expectations.


    Actionable Takeaways

    • TSX direction this week will be driven primarily by oil and geopolitical news flow.
    • Energy stocks provide downside protection during geopolitical shocks.
    • Weak Canadian macro data could limit upside for banks in the short term.
    • Base expectation: volatile consolidation rather than a directional trend.